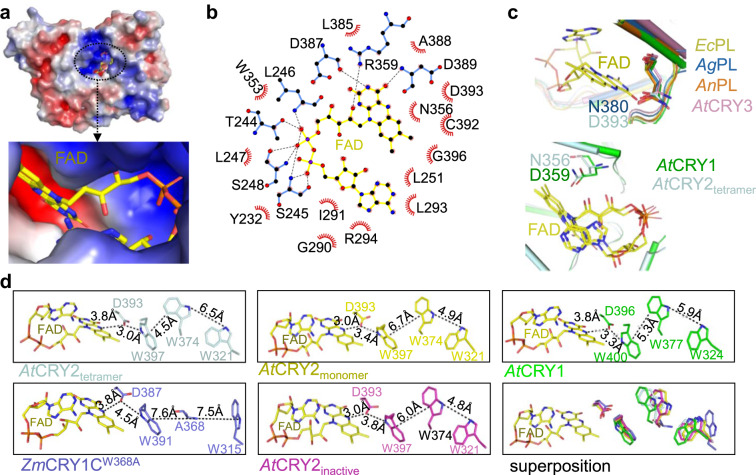
Fig. 5. Structural analyses of FAD binding pocket and tryptophan (Trp) triad.
a Electrostatic surface representation of AtCRY2-PHRtetramer and close up of FAD (yellow) binding cavity. Electrostatic potential is color coded on the surface with red and blue representing areas of negative and positive charges, respectively. b Interactions of AtCRY2-PHRtetramer with FAD. FAD in yellow is colored with carbon (black), nitrogen (blue) and oxygen (red). Dotted lines in black represent hydrogen bonds between AtCRY2-PHRtetramer and FAD. Hydrophobic interactions are shown as spoked arcs (red) (prepared by LigPlot). c Close up view of FAD (yellow) and diverged residues within the binding pocket of AtCRY2-PHRtetramer (D393, light blue) superposition with AtCRY1 (D396, green, PDB: 1U3C), Arabidopsis, AtCRY3 (N428, Magenta, PDB:2VTB), Agrobacterium tumefaciens Photolyase, AgPL (N380, blue, PDB:4U63)41, Escherichia coli Photolyase, EcPL (N378, Yellow, PDB: 1DNP)64, and Anacystis nidulans Photolyase AnPL (N386, orange, PDB:1TEZ)65. d Comparative analysis of plant cryptochromes tryptophan triad positions in relation to FAD. Residues are colored as in c. Distances were measured with PyMOL and indicated in dotted lines.

