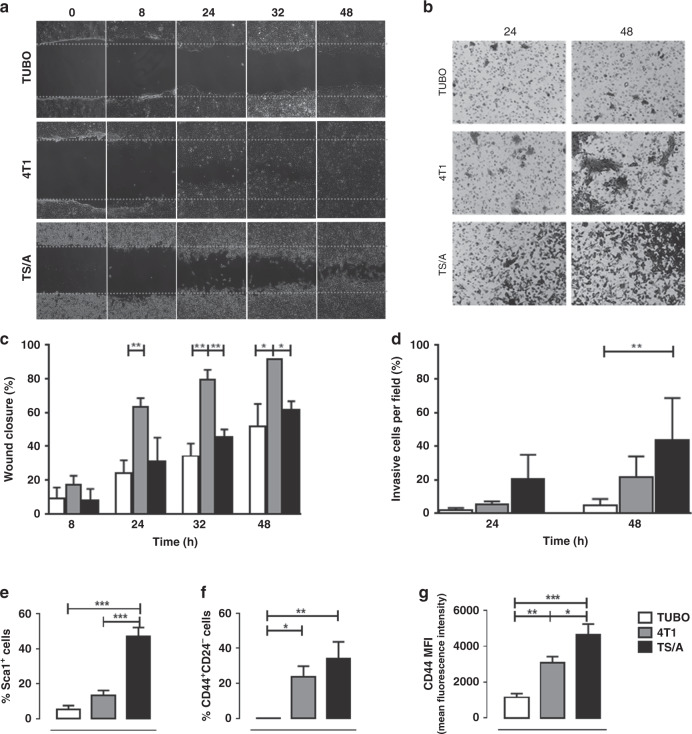
Fig. 1. Characterisation of migration and invasion capability in vitro of TUBO, 4T1 and TS/A cells.
a Representative images of cell migration and wound repair; cells were allowed to migrate 8, 24, 32 and 48 h after wounding. b Representative images of cell invasion; cells were allowed to invade the Matrigel-coated transwell membrane for 24 and 48 h. c TUBO cell migration and wound repair capability was slower compared to 4T1 cells; data are shown as mean ± SD (n = 3). *P < 0.05; **P < 0.01. d TS/A cells were the most invasive cells after 24 and 48 h; data are shown as mean ± SD (n = 3). **P < 0.01. e–g Graphs showing the mean ± SD of Sca1+, CD44+CD24− cells and CD44 mean fluorescence intensity (MFI) from three independent experiments. *P < 0.05; **P < 0.01; ***P < 0.001.

