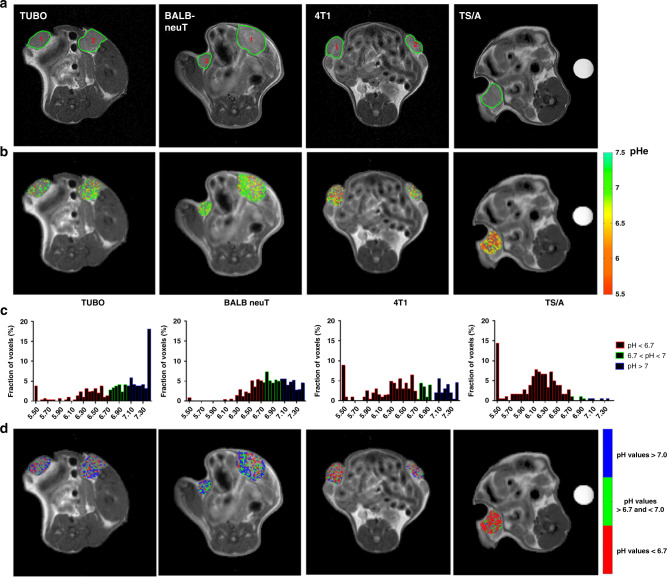
Fig. 5. 4T1 and TS/A displayed more acidic tumour environment.
a Anatomical T2w images of TUBO, BALB-neuT, 4T1 and TS/A representative tumours. b Representative tumour extracellular pH maps for TUBO, BALB-neuT, 4T1 and TS/A tumours. c pH frequency distribution of TUBO, BALB-neuT, 4T1 and TS/A representative tumours. For TUBO, BALB-neuT and 4T1, the distribution was calculated as the mean frequency distribution in the two tumours. d Corresponding acidity score maps (colour-coded as red for pixels showing pH values <6.7; green for pH values >6.7 and <7; blue for pH values >7.0) superimposed on anatomical images. Tumour pHe and acidity score values are shown only within tumour regions for improving clarity.

