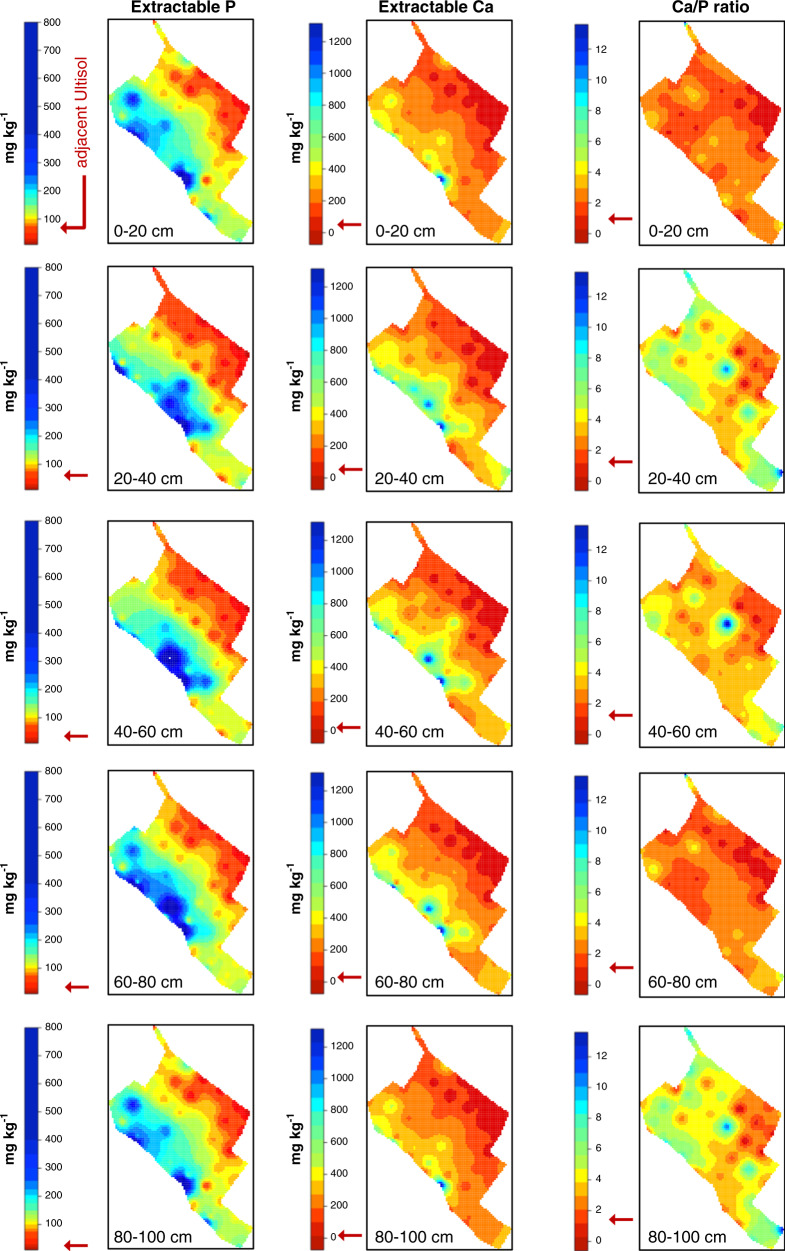
Fig. 2. Concentration of extractable phosphorus (P) and calcium (Ca) and their ratios in ADE and Ultisol profiles.
Spatial interpolation maps developed using first-order kriging of reference profiles (white circles; Fig. 1) indicate a depositional gradient from ADEs near the paleochannel levee toward nutrient-poor Ultisols. Red arrows indicate approximate values measured in the adjacent maximum contrast Ultisol profiles under rainforest (red triangles; Fig. 1).

