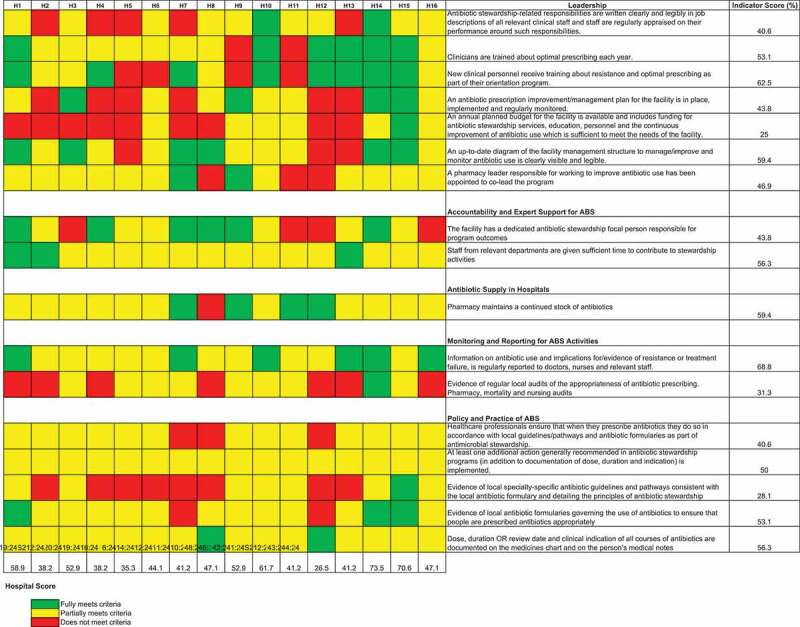
Figure 1.

Performance based on 17 indicators grouped in 5 different domains is shown by the upper vertical bars. The right horizontal bars summarise the performance of each indicator across 16 hospitals. The tiles in the central grid are coloured according to the performance classification of each indicator in each hospital, as shown in the colour legend
