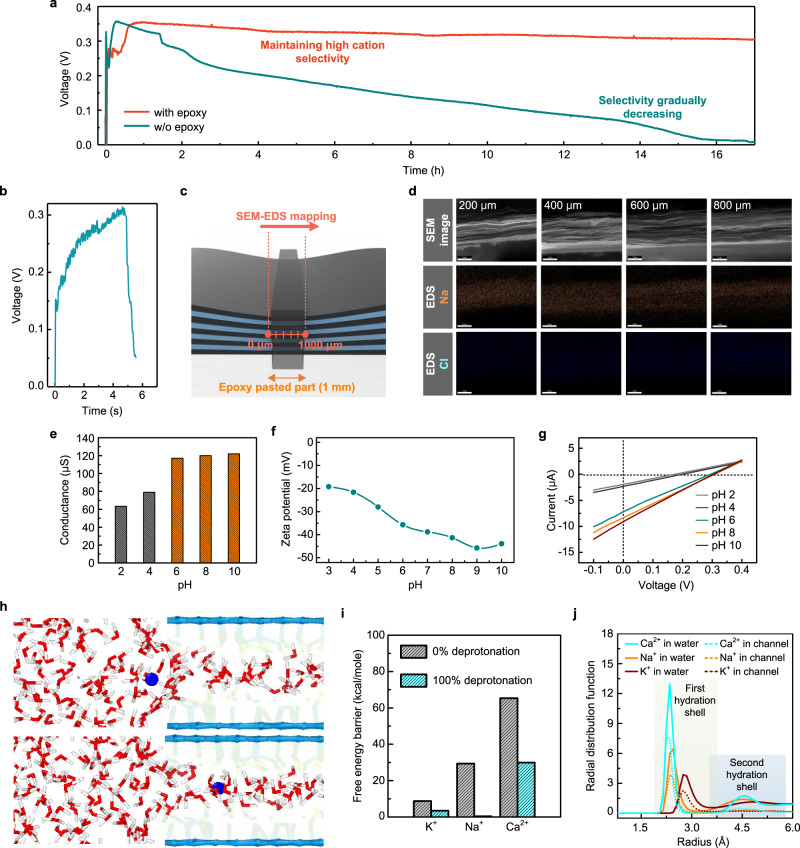
Fig. 3. Ion mobility of sodium ions in the angstrom-scale channel.
a Open-circuit voltage with respect to time under a concentration gradient of 103. Epoxy-pasted cells maintain a more stable voltage than non-epoxy-pasted cells. b Open-circuit voltage data with respect to time to assess the transition from non-steady-state to steady-state diffusion. c. Schematic of the part on which SEM–EDS mapping analysis is applied. d SEM–EDS mapping results of epoxy-pasted part (1 mm). Scale bars, 2 μm. e Ionic conductance value of GO membrane as a function of pH at 1 M NaCl. f Zeta potential of GO. g I–V curve data under a concentration gradient of 103 across the channel with various pH conditions. h The simulation showing the ion entrance into the GO channel. Carbon atoms in GO sheets are shown as blue plates, oxygen as green spheres, hydrogen in yellow, Na+ in blue, water oxygen in red, and water hydrogen in white. i Free energy barriers of ion dehydration when ions enter the GO channel. j Radial distribution function of oxygen atoms on water molecules around the ions in confined GO channels and bulk water.

