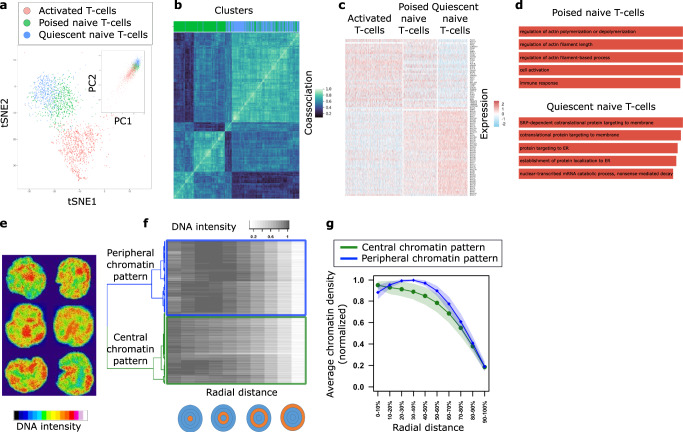
Fig. 3. Analysis of single-cell RNA-seq data and single-cell chromatin images of naive CD4+ T-cells reveals two distinct subpopulations respectively.
a t-SNE and PCA (inset) embeddings of single-cell RNA-seq data derived from31. Cluster analysis reveals activated (red) population of T-cells and naive population of T-cells divided into two subpopulations (poised and quiescent, denoted in green and blue, respectively). b Consensus clustering plot demonstrating the robustness of quiescent (blue) and poised (green) clusters of naive T-cells to various clustering methods. Gene expression data was clustered using k-means, Gaussian mixture models, and spectral clustering based on a k-nearest neighbor graph with k ∈ {10, 20, 50, 100} with 100 initializations for each method. c Differential gene expression analysis between the blue and green subpopulations reveals two distinct gene expression programs. The green subpopulation of naive T-cells is more similar to the activated T-cells and hence poised for activation, while the blue subpopulation shows an upregulation of ribosomal genes and has a relatively more quiescent expression profile. d Gene ontology enrichment analysis of marker genes for quiescent and poised naive T-cell subpopulations supports two distinct gene expression programs. e Examples of DAPI-stained nuclear images of naive CD4+ T-cells. f Cluster analysis of the 3D nuclear images is performed by first quantifying the chromatin signal in concentric spheres with increasing radii, and then using hierarchical clustering on these spatial chromatin features. The features were clustered using hierarchical clustering with complete linkage based on the distance matrix obtained from 1-Spearman’s correlation. g Average chromatin signal, calculated using n = 729 cells from two biologically independent replicates, (mean represented by the solid line and standard deviation represented by shading) in concentric spheres with increasing radii for central (green) and peripheral (blue) clusters. One cluster has higher concentration of chromatin in the central region of the nucleus (green), while the other cluster has higher concentration of chromatin in the peripheral region of the nucleus (blue).

