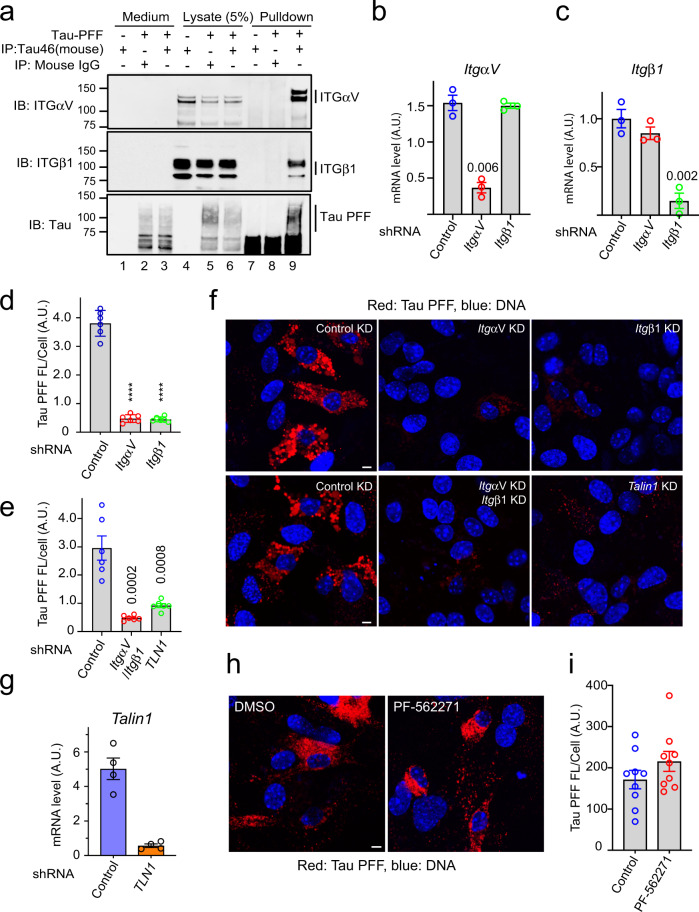
Fig. 2. Integrin αV/β1 and Talin1 are required for Tau PFF uptake in astrocytes.
a Co-immunoprecipitation of Tau PFF and ITGαV/β1. Astrocytes were treated with Tau PFFs or PBS as a control. Cell lysates were subjected to immunoprecipitation with either a control IgG or a Tau specific antibody (Tau-46). Both lysates and precipitated proteins were analyzed by immunoblotting. Where indicated, a fraction of the medium collected after the binding was also analyzed by immunoblotting. b, c Quantification (mean ± SEM) of mRNA expression by qRT-PCR performed 72 h postlentiviral infection confirmed the knockdown efficiency of ITGαV (b), β1 (c). A.U. arbitrary unit. n = 3 biologically independent experiments. The numbers above indicate p values determined by two-tailed unpaired t-test. d–g Astrocytic uptake of Tau PFF is dependent on ITGαV/β1 and Talin1. f Representative images of lentivirus-treated astrocytes incubated with Alexa594 (Red)-labeled Tau-PFF (200 nM) for 2 h. Cells were stained with Hoechst to label the nuclei (blue). Scale bar, 5 μm. d, e Quantification of the relative Tau PFF fluorescence intensity/cell. Mean ± SEM, n = 3 biologically independent experiments. The numbers and asterisks above indicate p values (****p < 0.0001) determined by two-tailed unpaired t-test. Dots represent the average fluorescence intensity/cell from images (>20 cells/image) acquired. g As in b, except that Talin1 mRNA expression was determined after Talin1 knockdown. Mean ± SEM, n = 4 biologically independent samples. h, i FAK is not required for Tau PFF uptake. h Representative images of DMSO or PF-562271-treated astrocytes (10 µM) incubated with labeled Tau-PFF (200 nM) after 2 h. Scale bar, 5 μm. i Quantification of Tau PFF uptake in h. Mean ± SEM, n = 3 biologically independent experiments. Dots represent average fluorescence intensity/cell from images acquired.

