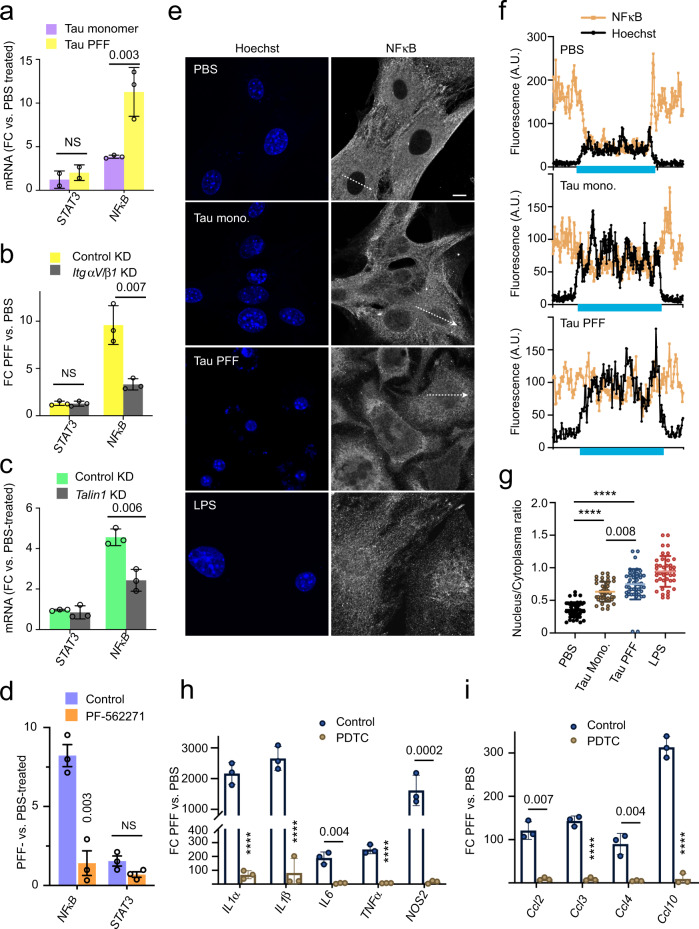
Fig. 5. Tau PFF-induced inflammation is dependent on NFκB activation.
a qRT-PCR analyses of the expression of NFκB and STAT3 in primary astrocytes exposed to PBS, monomeric Tau or Tau PFFs (200 nM) for 6 h. Shown are fold changes (FC) normalized to PBS-treated cells. Mean ± SEM, n = 3 independent experiments each with two technical repeats. b, c As in a, except that cells were first infected with control or ITGαV/β1 shRNA (b), or Talin1 shRNA (c) for 72 h and then incubated with PBS or Tau PFFs (200 nM) for 6 h. Mean ± SEM, n = 3 independent experiments. d As in b, except that control-treated or PF-562271-treated astrocytes were used. Mean ± SEM, n = 3 independent experiments. e–g Tau PFF increases NFκB nuclear translocation. e Representative confocal images of astrocytes treated with either PBS, Tau monomer, PFFs (200 nM) for 4 h or LPS as a positive control (5 μM) for 30 min. Cell were fixed and stained with a NFκB antibody and Hoechst (blue). The graphs in f show the fluorescence intensity profile along the lines indicated in e. The blue bars indicate nuclear regions. g Quantification of the nuclear/cytoplasmic NFκB ratio in randomly selected cells. Mean ± SEM, n = 3 biologically independent experiments. h, i Tau PFF-induced inflammation is suppressed by a NFκB inhibitor. As in d, except that cells were pre-treated with PDTC (90 μM) for 1 h before Tau PFF and PBS treatment and that the indicated genes were analyzed. Mean ± SEM, n = 3 independent experiments. The numbers and asterisks above indicate p value (****p < 0.0001) determined by two-tailed unpaired t-test.

