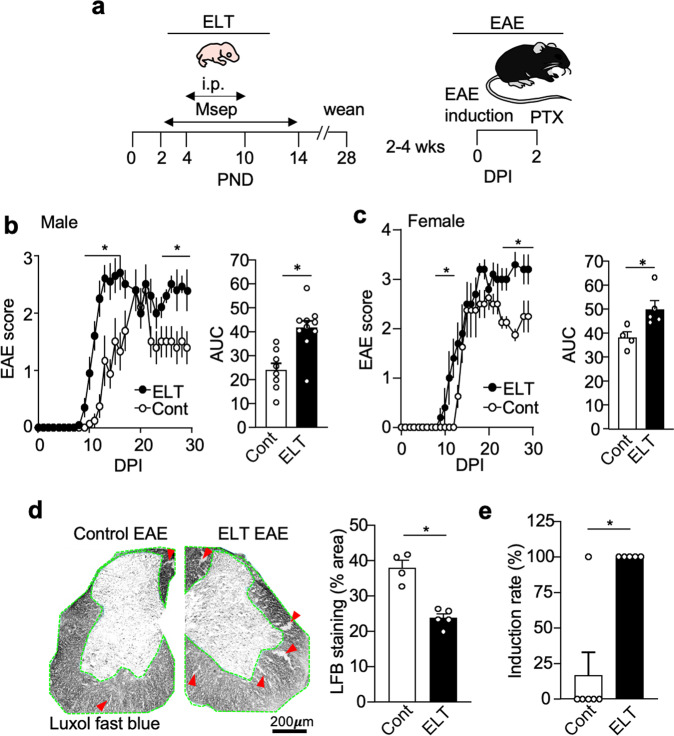
Fig. 1. ELT impacts EAE susceptibility, severity, and duration in both male and female mice.
a Schematic representation of experimental procedure. PND and DPI indicate postnatal day and day post-EAE induction, respectively. b Mean clinical EAE scores and cumulative scores of male mice (Cont EAE: n = 8, ELT-EAE: n = 10). c Mean clinical EAE scores and cumulative scores of female mice (Cont EAE: n = 4, ELT-EAE: n = 5). d Spinal cord sections of EAE mice stained for myelin using Luxol-fast blue at 20 dpi (Cont EAE: n = 4, ELT-EAE: n = 5) with quantitative analysis of stained area. Green outline indicates analyzed white matter region of interest. Red arrows indicate representative demyelination regions. e EAE induction rate among mice treated with low-dose Mtb (50 μg/mouse, Cont EAE: n = 6, ELT-EAE: n = 5). Results are representatives of at least two independent experiments. Each dot represents averaged data per animal. Data are represented as mean ± SEM. Two-tailed Student’s t-test, *P < 0.05. Exact P values for asterisks: b 0.0010, c 0.0288, d 0.0004, and e 0.0112.

