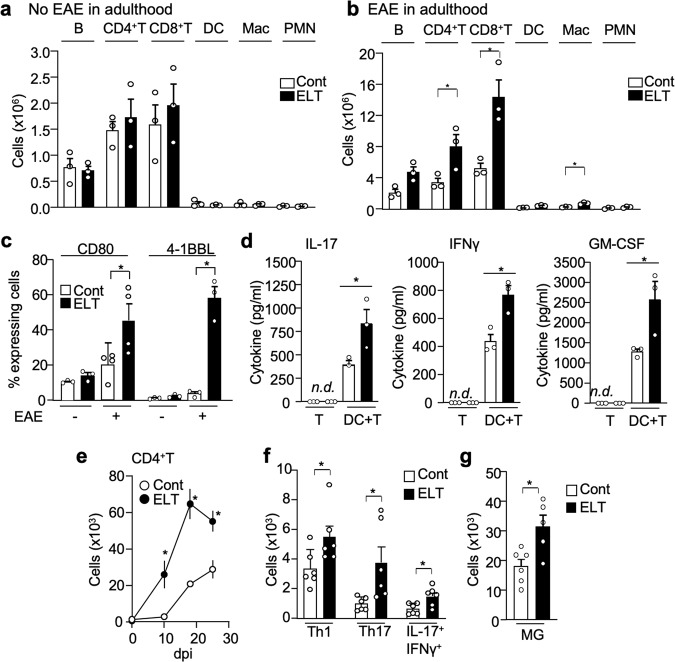
Fig. 2. ELT alters peripheral and CNS immune cell profiling.
a, b Absolute immune cell numbers (B cell: CD19+, CD4+T cell: CD3+CD4+, CD8+T: CD3+CD8+, dendritic cell: CD11b+CD11c+, macrophage: CD11b+CD11c−, neutrophil: CD11b+Ly6Ghigh) in control and ELT mice without (a) and with (b) EAE. Cells were isolated from draining lymph nodes were isolated from EAE mice at 10 dpi (n = 3 per group). c Percentage of co-stimulatory molecule (CD80 and 4-1BBL) expressing dendritic cells (CD80: n = 4 per group: 4-1BBL: n = 3 per group). d Amount of cytokines IL-17, interferon γ (IFNγ), and GM-CSF in supernatant derived from culture conditions 72 h post culture initiation. CD4+ T cells were isolated from draining lymph nodes of ELT-EAE or control EAE mice on 10 dpi to be supplemented with MOG (10 μg/ml) and cultured alone or with isolated dendritic cell isolated from ELT-EAE or control EAE mice (n = 3 per group). White and black bars represent data from control and ELT conditions, respectively. e Absolute numbers of CD4+T (CD45+CD3+CD4+) cells in spinal cord isolated from EAE mice on 0, 10, 18, and 25 dpi (n = 5 per group). f Absolute numbers of IL-17+-secreting CD4+T (Th17), interferon γ+-secreting CD4+T cells (Th1), and IL-17+ interferon γ+ CD4+T cells in the spinal cord of EAE mice at 25 dpi (n = 6 per group). g Absolute numbers of microglia (MG: CD45lowCD11b+) in the spinal cord at 25 dpi (n = 5 per group). Each dot represents averaged data per animal. Data are represented as mean ± SEM. Two-tailed Student’s t-test, *P < 0.05. Exact P values for asterisks (from left to right): b 0.0497, 0.0172, 0.0050; c 0.0456, 0.0013; d 0.0478, 0.0164, 0.0470; e 0.005, 0.0004, 0.0062; f 0.045, 0.022, 0.021; and g 0.0140.

