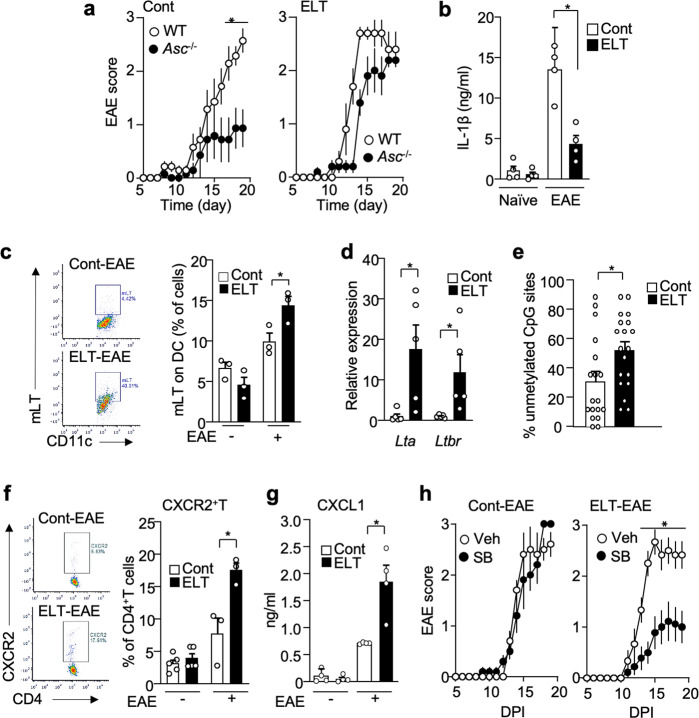
Fig. 5. Distinct immune markers in ELT-EAE mice.
a EAE scores after EAE induction in control- and ELT mice of wild type and Asc−/− mice (Cont-WT: n = 4, Cont-Asc−/−: n = 5, ELT-WT: n = 6, ELT-Asc−/−: n = 5). b Serum levels of IL-1β at 10 dpi (Cont naïve: n = 4, ELT naïve: n = 4, Cont EAE: n = 3, ELT-EAE: n = 3). c Percentage of mLT-expressing dendritic cells (DC) at 10 dpi (n = 3 animals/group). d Expression of Lta and Ltbr mRNA in DC obtained from lymph nodes of control EAE and ELT-EAE mice at 10 dpi (n = 5 animals/group). e Percentage of unmethylated CpG sites in the promoter region of LT gene in dendritic cells isolated from lymph nodes of control and ELT mice without EAE at 10 dpi (n = 18 colonies). f Percentage of CXCR2-expressing CD4+T cells at 10 dpi (Cont naïve: n = 5, ELT naïve: n = 5, Cont EAE: n = 3, ELT-EAE: n = 3). g Serum levels of CXCL1 at 10 dpi (n = 4 animals/group). h EAE score of mice treated with CXCR2 inhibitor SB225002 (SB) or saline (Cont-Vehicle: n = 5, Cont-SB: n = 5, ELT-Vehicle: n = 6, ELT-SB: n = 9). Male mice were used for experiments. Each dot represents averaged data per animal. Data are represented as mean ± SEM. Two-tailed Student’s t-test, *P < 0.05. Exact P values for asterisks (from left to right): a 0.0131; b 0.0032; c 0.0449; d 0.0252, 0.0447; e 0.0210; f 0.0221; g 0.0088; and h 0.0084.

