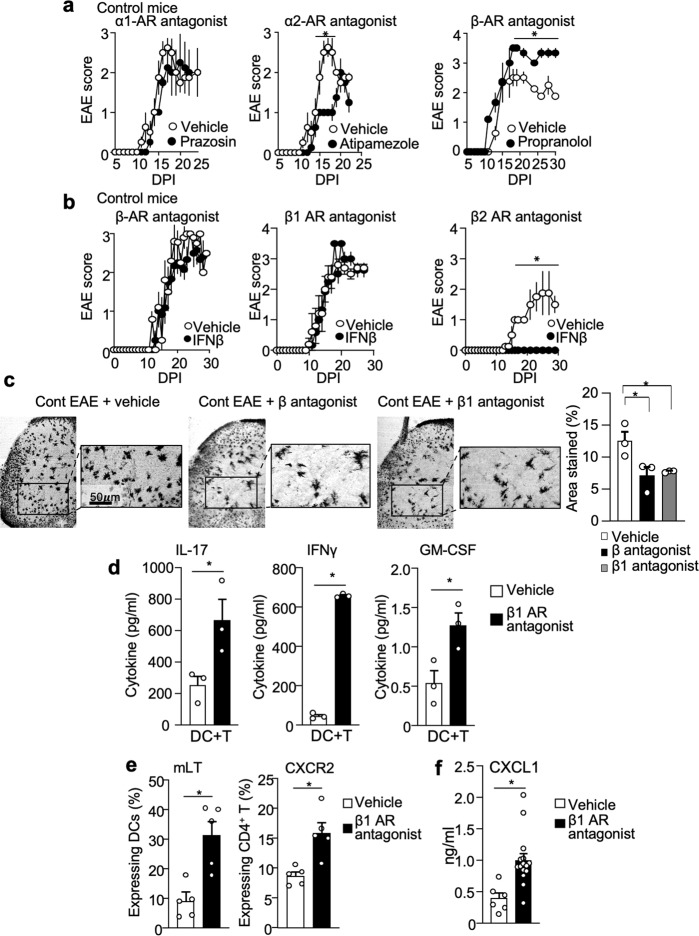
Fig. 7. β1 adrenergic receptor antagonism is sufficient to reproduce the ELT-induced EAE phenotypes.
a EAE scores of control mice with intraperitoneal injections of α1-AR antagonist (prazosin, 5 mg/kg), α2-AR antagonist (atipamezole, 5 mg/kg), or β-AR antagonist (propranolol, 5 mg/kg) with vehicle control (n = 4 animals/group). All drugs were treated from 0 to 10 dpi every other day. b EAE scores of IFNβ-treated control EAE mice subjected to β-AR antagonist (propranolol, 5 mg/kg), β1-AR antagonist (metoprolol tartrate, 5 mg/kg), β2-AR antagonist (ICI 118,55, 1 mg/kg), or vehicle treatment (β-AR antagonist-Veh: n = 5, β-AR antagonist-IFNβ: n = 5, β1-AR antagonist-Veh: n = 5, β1-AR antagonist-IFNβ: n = 6, β2-AR antagonist-Veh: n = 4, β2-AR antagonist-IFNβ: n = 4). c Representative images stained quantification of Golgi–Cox staining in the ventral lumbar spinal cord region of vehicle-treated and β1-AR antagonist-treated control EAE mice at 30 dpi. Quantification of area stained by Golgi–Cox (n = 3 animals/group). d Amount of cytokines IL-17, interferon γ (IFNγ), and GM-CSF in supernatant derived from culture conditions 72 h post culture initiation. CD4+T cells were isolated from draining lymph nodes of control EAE mice and mice subjected to β1-AR antagonist (n = 3 animals/group). e Percentages of mLT-expressing lymph node DCs and CXCR2-expressing CD4+T cells from EAE mice with β1-AR antagonist or vehicle treatment (n = 5 animals/group). f Serum levels of CXCL1 at 10 dpi (n = 4 animals/group). Male mice were used for experiments. Each dot represents averaged data per animal. Data are represented as mean ± SEM. Student’s t-test, *P < 0.05. Exact P values for asterisks (from left to right): a 0.0004; b <0.0001; c 0.0498; 0.0318; d 0.0462, <0.0001, 0.0322; e 0.0032, 0.0048; f 0.0034.

