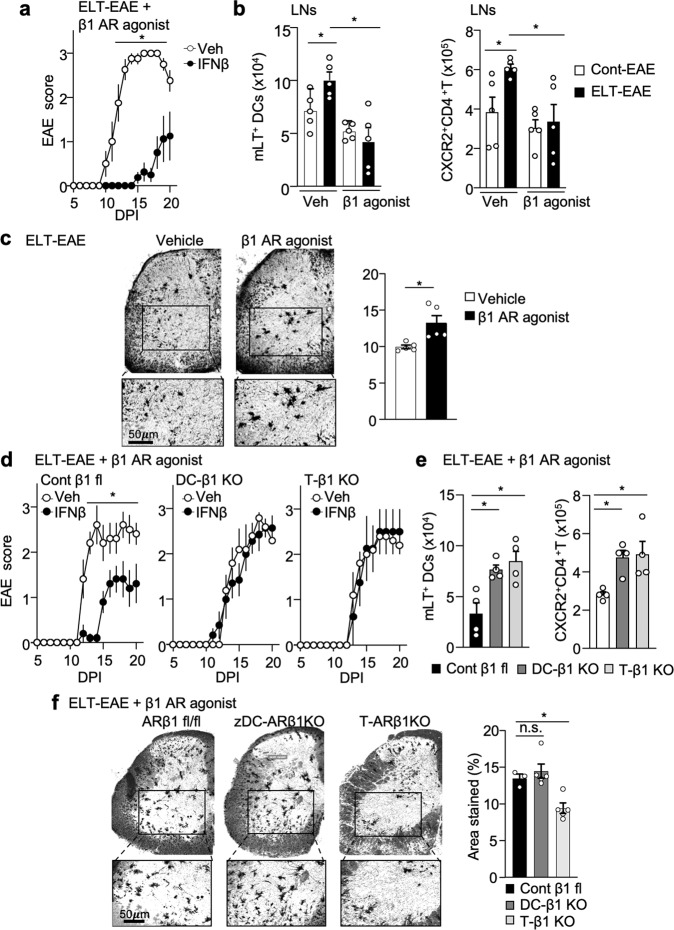
Fig. 8. β1-AR agonist treatment is sufficient to rescue ELT-EAE subtype.
a EAE scores of IFNβ-treated ELT-EAE mice subjected to β1-AR agonist (Xamoterol, 3 mg/kg) treatment (ELT-β1-AR agonist-Veh: n = 4, ELT-β1-AR agonist-IFNβ: n = 8). Interferon-β was treated from 0 to 9 dpi once every 3 days. Xamoterol was treated from 0 to 10 dpi every other day. b Absolute number of mLT-expressing lymph node DCs and CXCR2-expressing CD4+T cells from EAE mice with β1-AR agonist or vehicle treatment (n = 5 animals/group). c Golgi–Cox-stained lumbar spinal cord sections of ELT-EAE mice treated either with vehicle or with β1-AR agonist isolated at 30 dpi with quantification of area stained/per field (n = 5 animals/group). d EAE scores of IFNβ-treated control β1-AR fl ELT-EAE mice, dendritic cell (DC)-specific β1-AR knockout ELT-EAE mice, and T cell-specific β1-AR knockout ELT-EAE mice subjected to β1-AR agonist (Xamoterol, 3 mg/kg) treatment (ELT-β1-AR agonist-Cont-Veh: n = 5, ELT-β1-AR agonist-Cont-IFNβ: n = 5, ELT-β1-AR agonist-DC-β1KO-Veh: n = 5, ELT-β1-AR agonist-DC-β1KO-IFNβ: n = 7, ELT-β1-AR agonist-T-β1KO-Veh: n = 5, ELT-β1-AR agonist-T-β1KO-IFNβ: n = 5). Interferon-β was treated from 0 to 9 dpi once every 3 days. Xamoterol was treated from 0 to 10 dpi every other day. e Absolute number of mLT-expressing lymph node DCs and CXCR2-expressing CD4+T cells from control β1-AR fl ELT-EAE mice, DC-specific β1-AR knockout ELT-EAE mice, and T cell-specific β1-AR knockout ELT-EAE mice subjected to β1-AR agonist (Xamoterol, 3 mg/kg) treatment (n = 4 animals/group). f Golgi–Cox-stained lumbar spinal cord sections of β1-AR agonist treated ELT-EAE mice of different transgene knockout conditions at 30 dpi with quantification of area stained/per field (ELT-β1-AR agonist-Cont: n = 3, ELT-β1-AR agonist-DC-β1KO: n = 5, ELT-β1-AR agonist-T-β1KO: n = 5). Male mice were used for experiments. Each dot represents averaged data per animal. Data are represented as mean ± SEM. Student’s t-test, *P < 0.05. Exact P values for asterisks (from left to right): a 0.0027; b 0.0258, 0.0131, 0.0223, 0.0159; c 0.0135; d 0.0054; e 0.0110, 0.0145, 0.0033, 0.0244; and f 0.0077.

