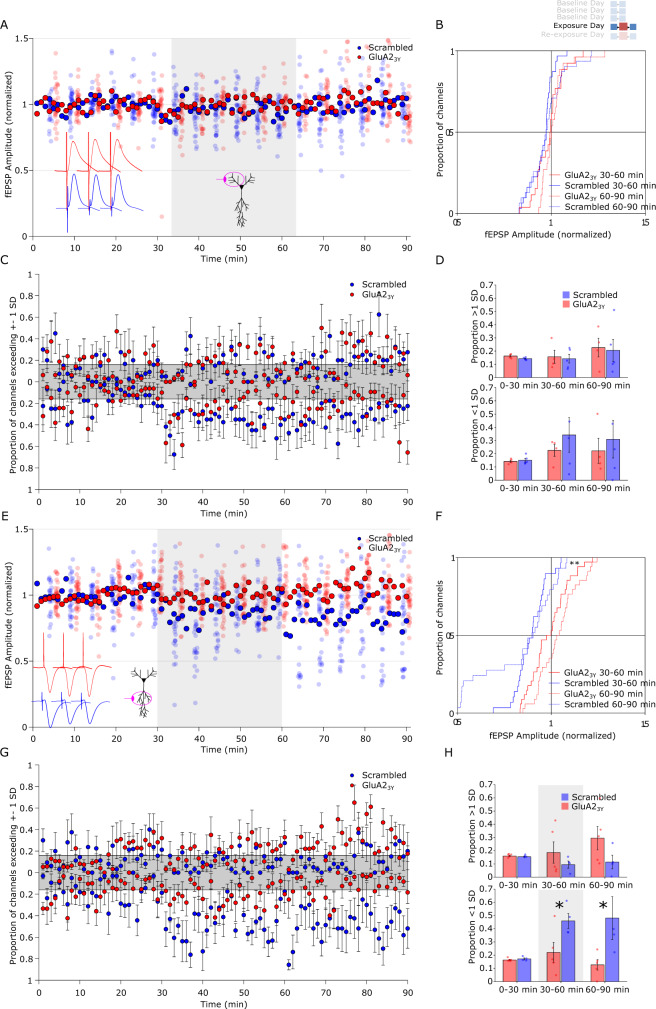
Fig. 2. Novelty exposure induced fEPSP reduction is blocked by AMPA-receptor endocytosis inhibition.
tat-GluA23Y peptide or a Scrambled control (2.25 μmol/kg in saline, IV) was delivered 30 min prior to recording on the exposure day. A Stratum oriens stimulation evoked fEPSPs in GluA23Y (red) or Scrambled (blue) treated rats. Solid marker indicates the cross-channel average, while each channel is plotted every 5 stimulations and offset for clarity. B Cumulative distribution of oriens-evoked fEPSPs showed no difference between treatment groups during or after novelty exposure (red, GluA23Y n = 26 channels; blue, Scrambled, n = 31 channels). C Per-animal proportion of channels exceeding 1 standard deviation of the channel’s baseline variance at each stimulation. Shaded area represents the proportion of channels expected to be above or below 1 standard deviation based on a normal distribution. (n = 4 GluA23Y, n = 5 Scrambled). D Proportion of channels exceeding 1 standard deviation above (top graph) or below (bottom graph) baseline in each epoch. No significant change in distribution was observed in either treatment group during or after novelty exposure treatment (n = 4 GluA23Y, n = 5 Scrambled). E Stratum radiatum evoked fEPSPs in GluA23Y (red) and Scrambled (blue) treated rats. F Cumulative distribution of radiatum-evoked fEPSPs showed a widespread decrease during novelty exposure (solid) and on return to the familiar chamber (dashed) that was blocked by GluA23Y treatment (red, n = 34 channels; blue, Scrambled, n = 29 channels). G Per-animal proportion of channels exceeding 1 standard deviation of the channel’s baseline variance at each stimulation (n = 5 GluA23Y, n = 4 Scrambled). H Proportion of channels averaged in each epoch indicate a specific increase in the proportion of channels lower than 1 standard deviation from baseline in the radiatum channel during after exposure to the novel environment that was blocked by GluA23Y treatment (n = 5 GluA23Y, n = 4 Scrambled). *p < 0.05, **p < 0.01 follow-up t-test (two-tail) comparison between group for epochs after significant group by epoch ANOVA interaction, and ks-test for distribution. Error bars represent ± SEM.

