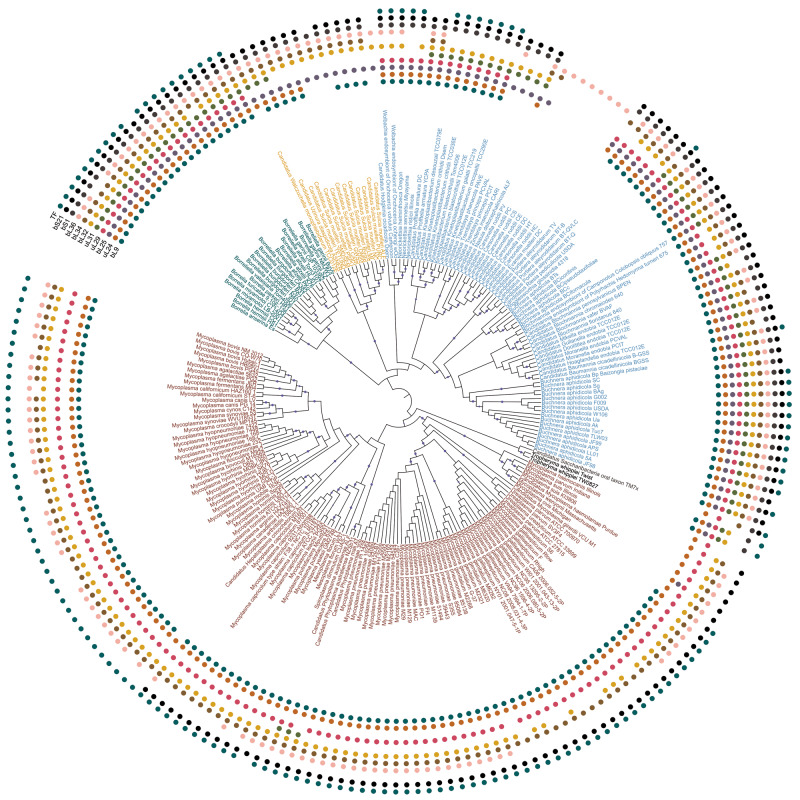
Fig. 1.
Maximum likelihood phylogenetic tree of analyzed bacterial species. The tree was constructed for the concatenated alignment of conserved r-proteins by PhyML with 100 bootstrap replicates. In this representation, the branch lengths are ignored (the tree with branch lengths is provided as supplementary fig. S2, Supplementary Material online). Bootstrap values in the range 0.9–1 are shown by blue circles. The presence of one of 11 frequently lost proteins (bL9, bL21, uL24, bL25, uL29, bL32, bL34, bL36, bS1, bS21, TF) in a strain is marked by a colored circle (inner to outer arcs, respectively). Leaves are colored by the phyla: Actinobacteria, black; Bacteroidetes, yellow; Proteobacteria, blue; Spirochaetes, green; Tenericutes, red; unclassified bacteria, gray.

