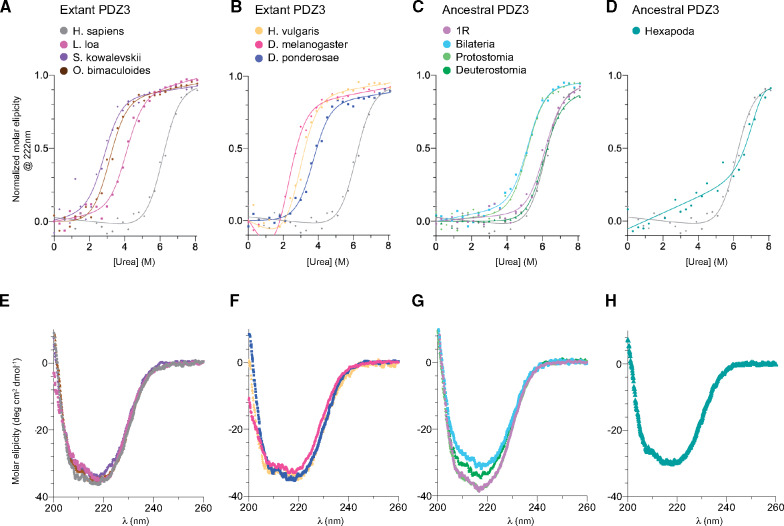
Fig. 6.
Secondary structure and global stability of extant and resurrected ancestral PDZ3 domains. (A–D) Urea denaturation (0–8.1 M) of extant and ancestral PDZ3 variants, as monitored by circular dichroism at 222 nm. Data were fitted to a two-state model for protein (un)folding. (See table 3 for fitted parameters.) To facilitate comparison, the urea denaturation curve of Homo sapiens PDZ3 (gray) is present in all graphs. (E–H) Secondary structure content analyzed by circular dichroism between 200 and 260 nm. Each spectrum is an average of five individual scans measured at 10 °C in 50 mM sodium phosphate, pH 7.45, 21 mM KCl (I=150 mM).

