
Figure 4.
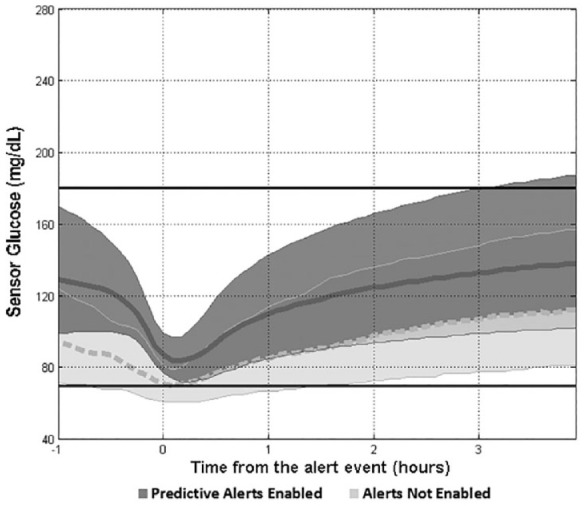
Low sensor glucose excursion and recovery. The median (thick curves) and interquartile ranges of sensor glucose values are shown 1 hour before and up to 4 hours after a predictive low sensor glucose alert event (time = 0). The Alerts Not Enabled control is shown as a light gray band with a dashed median curve, and the Predictive Alerts Enabled data set is shown as a dark gray band with a solid median curve. The horizontal lines at 70 and 180 mg/dL show the target glucose range.