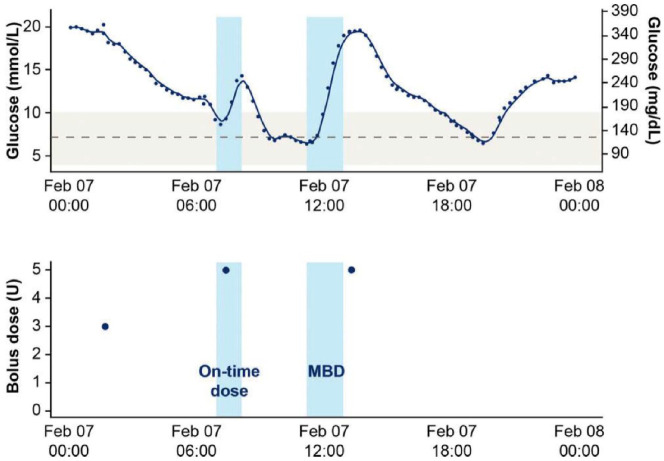
Figure 1.
(Top): CGM data from a day with two meals detected. The solid dark blue line represents the CGM signal. The light blue shaded areas each represent a meal detected with a glycemia rate-of-change algorithm. The gray, dashed line represents a glucose level of 130 mg/dL and the light gray shaded area represents a target glycemic range of 70-180 mg/dL.
(Bottom): Insulin dosing data from a smart insulin pen on the same day. The blue circles in the lower figure indicate bolus doses. A bolus dose within 15 minutes before to 60 minutes after the start of a meal is considered to be an on-time bolus dose. A dose outside of this 75-minute time window is considered a missed bolus dose (MBD). Note. CGM, continuous glucose monitoring.
Reproduced from Adolfsson et al51 with permission from Diabetes Technology and Therapeutics.

