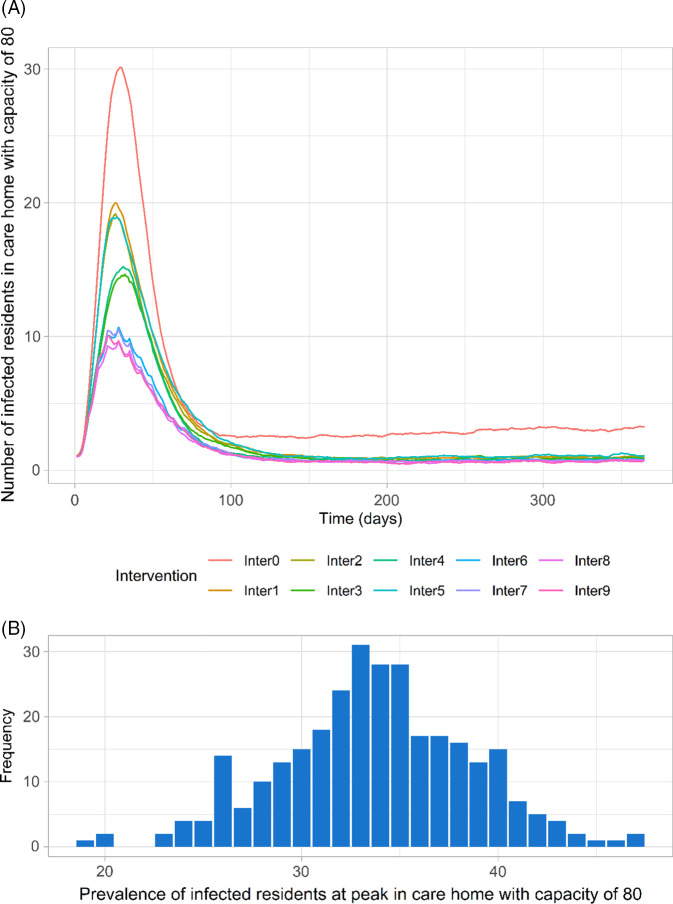
Fig. 2.
Time series of COVID-19 prevalence among residents in care home with capacity of 80 residents across all scenarios using the base case parameters (means of 300 simulations for each scenario) (A) and distribution of the prevalence at peak for no intervention scenario (Inter0) using the base case parameters for 300 simulations (B). (Inter0: No intervention; Inter1: Reference intervention (isolation of symptomatic/confirmed residents, testing of new admissions, closed to visitors, social distancing); Inter2: Inter 1 + isolation upon admission; Inter3: Inter1 + adaptive testing strategy; Inter4: Inter3 + isolation upon admission; Inter5: Inter1 + Weekly testing for residents; Inter6: Inter1 + weekly testing for staff; Inter7: Inter1 + weekly testing for staff and residents; Inter8: Inter6 + isolation upon admission; Inter9: Inter7 + isolation upon admission).

