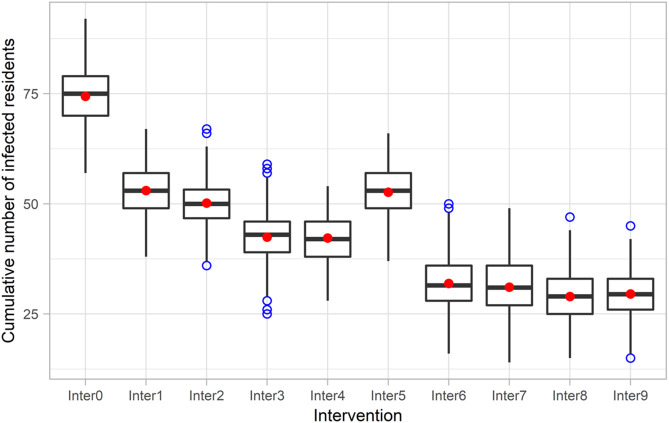
Fig. 4.
Box plot of cumulative numbers of infected residents 90 days after a resident is infected at the start of the simulation in nine intervention scenarios using the base case parameters (The result is presented as a box plot − lower hinge: 25% quantile; lower whisker: smallest observation greater than or equal to lower hinge − 1.5×IQR; middle: median; upper hinge: 75% quantile; upper whisker: largest observation less than or equal to upper hinge + 1.5×IQR; red dot: mean; blue dot: outlier). Note. IQR, interquartile range.

