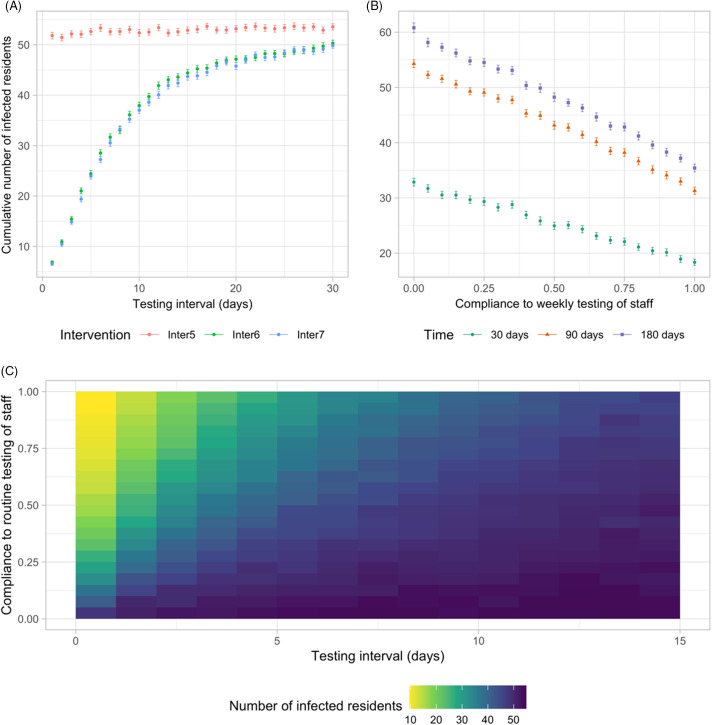
Fig. 5.
Effectiveness of different routine testing strategies and compliance. (A) The impact of different testing intervals in routine testing scenarios on the cumulative number of infections after 90 days. (B) The impact of compliance to weekly testing of staff (Inter6) on the cumulative number of infections after 30, 90, and 180 days. Other parameters take the values at base case. (Dots denote the mean values of 300 simulations and error bars represent 95% confidence interval of the mean.) (C) Heatmap plot for the impact of testing interval and compliance to routine testing of staff (Inter6) on the cumulative number of infections after 90 days.

