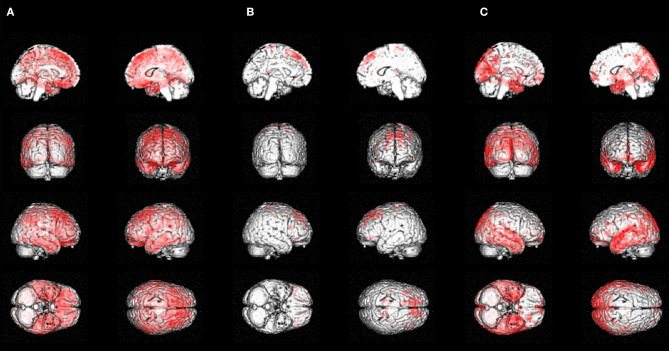
Figure 2.
Voxel-wise analysis: (A) Case compared to controls. (B) Case compared to prodromal AD (C) Prodromal AD compared to case. Significant voxels (p < 0.001, uncorrected) from a one-sample t-test for the: (A) negative contrast on the SUVR subtracted image [HC–participant] (regions of higher tau retention in the participant relative to A–/T– HC). (B) negative contrast on the SUVR subtracted image [MCI–participant] (regions of higher tau retention in the participant relative to the A+/T+ MCI comparison group). (C) positive contrast on the SUVR subtracted image [MCI–participant] (regions of higher tau retention in the A+/T+ MCI comparison group relative to the participant).

