Fig. 1.
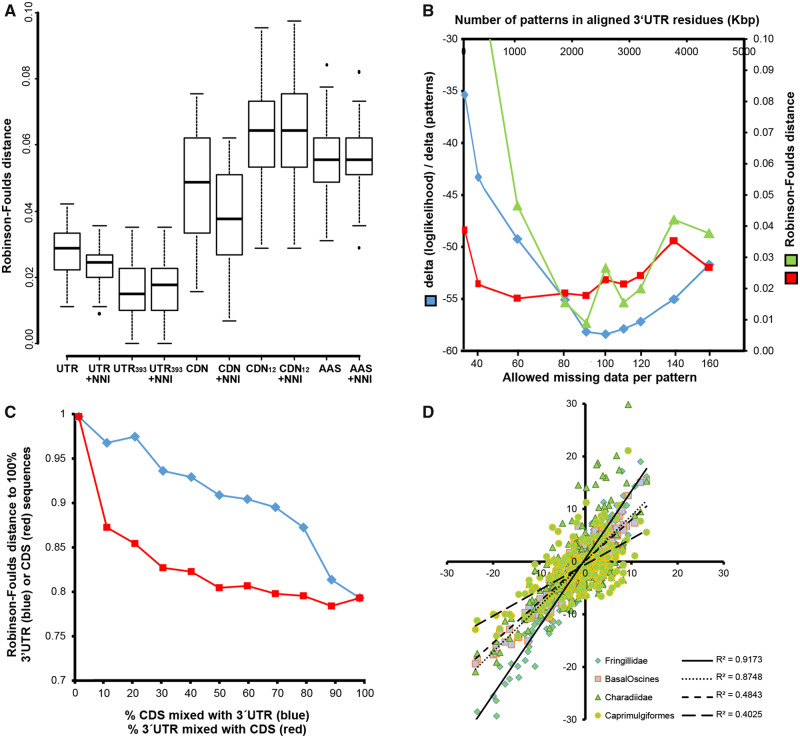
Analysis of tree topology congruency for different noncoding and coding data types (A–C) and taxon-specific sequences in 3′-UTRs (D). In (A), multiple tree inferences using distinct starting trees and subsequent refinement by nearest neighbor interchange (NNI) moves resulted in a better tree topology congruency (lower Robinson–Foulds distance) for 3′-UTR trees (UTR, 3′-UTRs of all species; UTR393, 3′-UTRs including only seven genomes of which no transcriptomes were available) as compared with trees calculated from similar amounts of coding sequence data (CDN, codons of all species; CDN12, codon positions 1 and 2 only, all species; AAS, amino acid sequence, all species); tree inference RAxML fast mode (-f E), model GTRCAT (or PROTCATJTTF) without or with NNI improvement under GTRGAMMA (PROTGAMMAJTTF) RAxML(-f J). In (B), we compared the rate of change of average per-site likelihood (blue) with the tree topology convergence (red; average Robinson–Foulds distances of ten trees), and the convergence of average trees from neighboring data points (green; Robinson–Foulds distance; e.g., average tree n compared with average tree n + 1,…). The rate of change of average per-site likelihood depends on the allowed-missing data in the alignments. The rate of change of average per-site likelihood can be computed fast (single inference per alignment) as compared with tree topology convergences (multiple inferences) and predicts an optimal number of allowed gaps per column in 3′-UTR multiple sequence alignments of about 100 missing species per pattern. (C) Influence of mixing 3′-UTR and CDS (coding sequences) on the resulting tree topology. Adding relatively small amounts of 3′-UTR to CDS had already a strong impact on the resulting tree topologies (red line), whereas adding small amounts of CDS to 3′-UTR had a much lower impact on the resulting tree (blue line). Note that both curves are different from the diagonal. (D) The 3′-UTRs of avian genes contain evolutionary signals that distinguish order- and family-level taxa. The similarity of the presence of transcription factor binding site motifs (TFBS) in 3′-UTRs of species decreases with increasing evolutionary distance between avian families. Shown are correlations (Z values) of the abundance of TFBS in 3′-UTRs of 97 randomly selected genes expressed in the passerine family Estrildidae versus Fringillidae, versus Basal Oscine families, versus family-level taxa of the order Charadriiformes, and the order Caprimulgiformes. The correlation of TFBS abundance between Charadriiformes and Caprimulgiformes (not shown) is R2=0.694. For the list of analyzed genes and species see supplementary table S3, Supplementary Material online.

