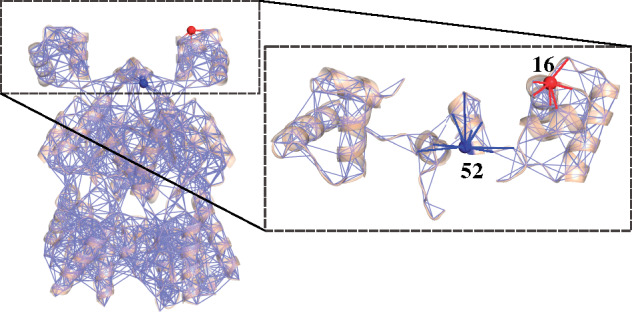
Fig. 2.

Protein structure interactions can be represented as inhomogeneous networks. In this example using LacI, each amino acid is represented as a node in the network, and covalent and noncovalent interactions are represented as edges. The expanded area in the dashed box shows a close-up view of the DNA-binding domains and linkers, with two positions highlighted (blue and red) to exemplify asymmetric coupling. Due to the inhomogenous interaction networks between positions 52 and 16 and their partner positions, a perturbation at the red site may induce a response at the blue site that differs in magnitude from the response arising at the red site with the blue site is perturbed.
