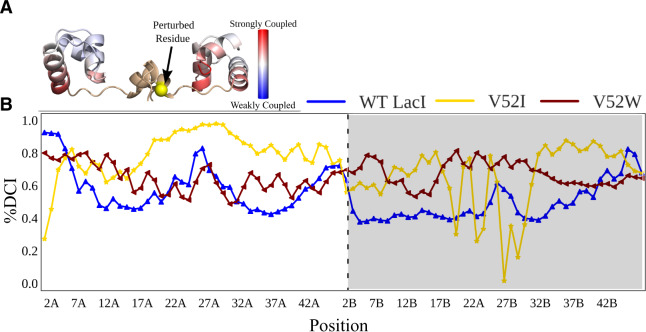
Fig. 5.
(A) Example DCI calculations mapped on the LacI DNA-binding domain/linker structure. The DCI values for all DNA binding and linker positions that result from perturbing position 52 (yellow sphere) are shown with the red to blue color gradient. (B) Percentile-ranked dynamic coupling between position 52 of chain A and the DNA-binding domain positions of WT LacI, V52W, and V52I. The “A” and “B” designations on the position numbers and the white/gray shading indicate the two monomers of a dimer. Connecting lines are to aid visual inspection of the data. Note the significant differences in the score profiles, even though both variants have Kd values that are similar to WT. See supplementary figure S7, Supplementary Material online for %DCI scores for other V52X variants.

