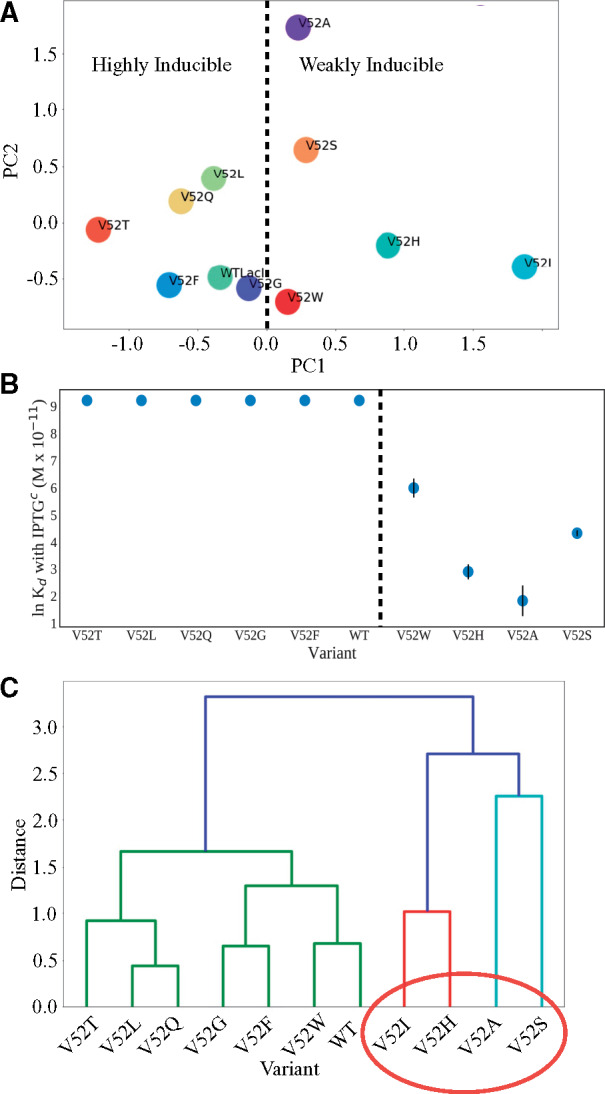
Fig. 6.

Principle component analyses of V52X %DCI scores. (A) Scatter plots of the first (PC1) versus second (PC2) principle components from the V52X to DNA-binding domain %DCI scores suggest a separation in the first principle component correlates with altered inducibility (table 1), where the dashed line separates positive from negative values of the first principle component. Strikingly, this also appears to identify variants with altered inducibility (table 1 and panel [B]). (B) Point plot of lnKd of DNA binding in the presence of IPTG. The dashed line marks the separation of highly inducible variants (Kd with IPTG > 10,000 M × 10−11) from weakly inducible variants and coincides with the dashed line in (A). The exception to this trend in PC1 may be V52I, which may comprise a third group as indicated by its position to the far right of panel (A). Biochemically measured values for V52I inducibility are not available, but this variant showed WT inducibility in repression assays (Meinhardt et al. 2013). (C) Hierarchical clustering dendrogram using Ward’s method (Ward 1963) over first three principle components. Clusters associate with DNA-binding Kd values both in the presence of IPTGc and without inducer (table 1). The colors represent clusters of variants within a given Ward distance cutoff used to define subgroups.
