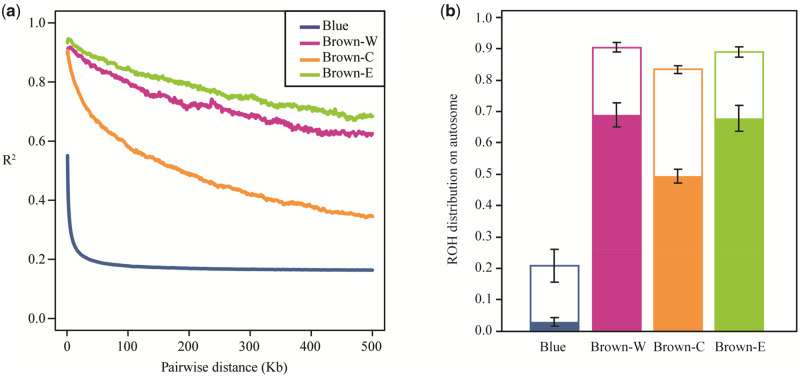
Fig. 4.
Genetic linkage disequilibrium (LD) and runs of homozygosity (ROHs). (a) LD decay is represented by change in average correlation (R2) between SNPs among all individuals per population as physical distance increases between SNPs. (b) Percentages of ROH on autosomes. Integral bars indicate fraction of all ROHs. Solid bars show fractions of long ROH ≥0.5 Mb. Blank bars show fraction of short ROH <0.5 Mb. Error bars are ±1 SD. Blue indicates Crossoptilon auritum. Brown-W, Brown-C, and Brown-E are three isolated C. mantchuricum populations.

