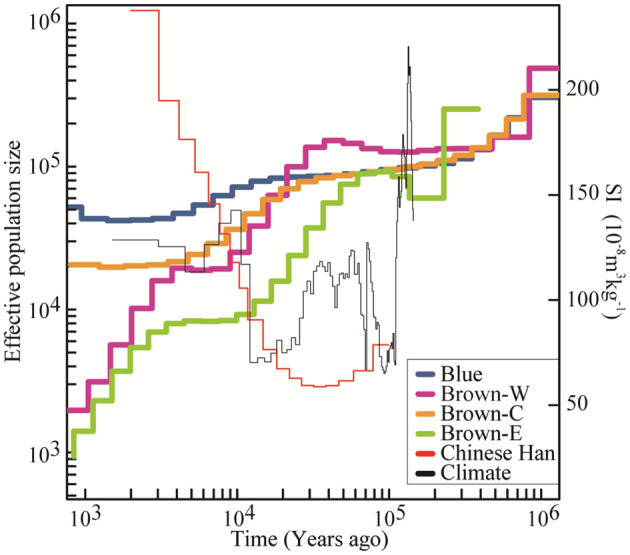
Fig. 6.

Demographic history of Crossoptilon mantchuricum and C. auritum reconstructed from autosomes using the multiple sequential Markovian coalescence (MSMC) model. Inferred fluctuations in effective population size (Ne) from 1 ka to 0.8 Ma based on the 2-year generation time and 4.02 × 10⁻⁹ per site per generation mutation rate assumptions. Blue line represents estimated Ne of C. auritum (blue). Purple, brown, and green lines represent Western (Brown-W), Central (Brown-C), and Eastern (Brown-E) C. mantchuricum populations, respectively. Red line represents Chinese Han population (CH). Black line shows magnetic susceptibility (SI) of central Chinese Loess Plateau. SI was a proxy for temperature.
