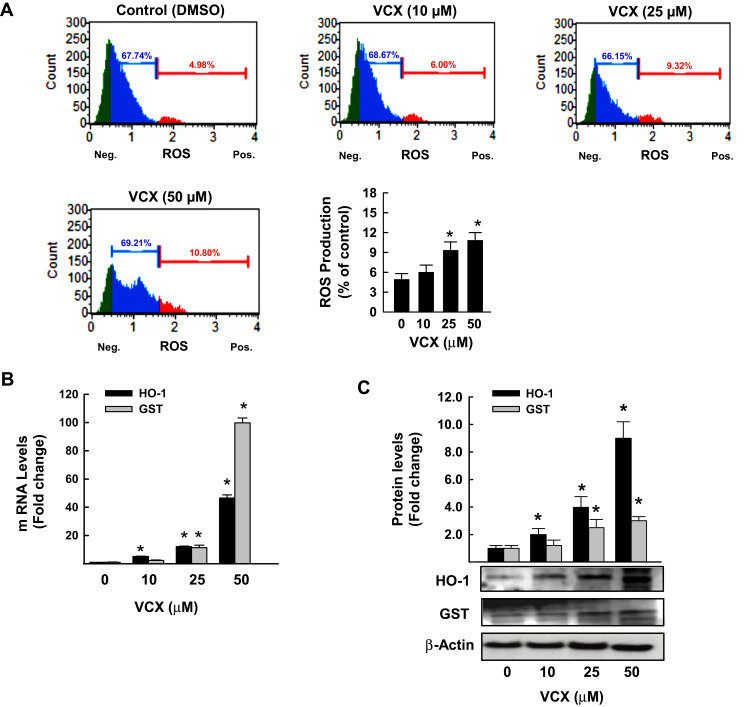
Figure 5.
Effect of VCX treatment on oxidative stress in MDA-MB-231cells. MDA-MB-231 cells were treated for 24 h with various concentrations of VCX (10, 25, and 50 μM). (A) Production of ROS was determined by Muse® Oxidative Stress Kit. The values represented the mean ± SEM, (n = 3, triplicate). *P< 0.05 compared to control, VCX=0 μM, (ANOVA followed by SNK test). (B) HO-1 and GSTA mRNA levels were quantified using qRT-PCR and normalized to β-actin housekeeping gene. The values are presented as mean ± SEM, (n = 6, triplicate). *P < 0.05 compared to control, VCX=0 μM, (ANOVA followed by SNK test). (C) HO-1 and GSTA protein expression levels were determined by Western blot analysis. One of three representative experiments is shown. The values represented the mean ± SEM, (n = 3). *p< 0.05 compared to control, VCX=0 μM, (ANOVA followed by SNK test).

