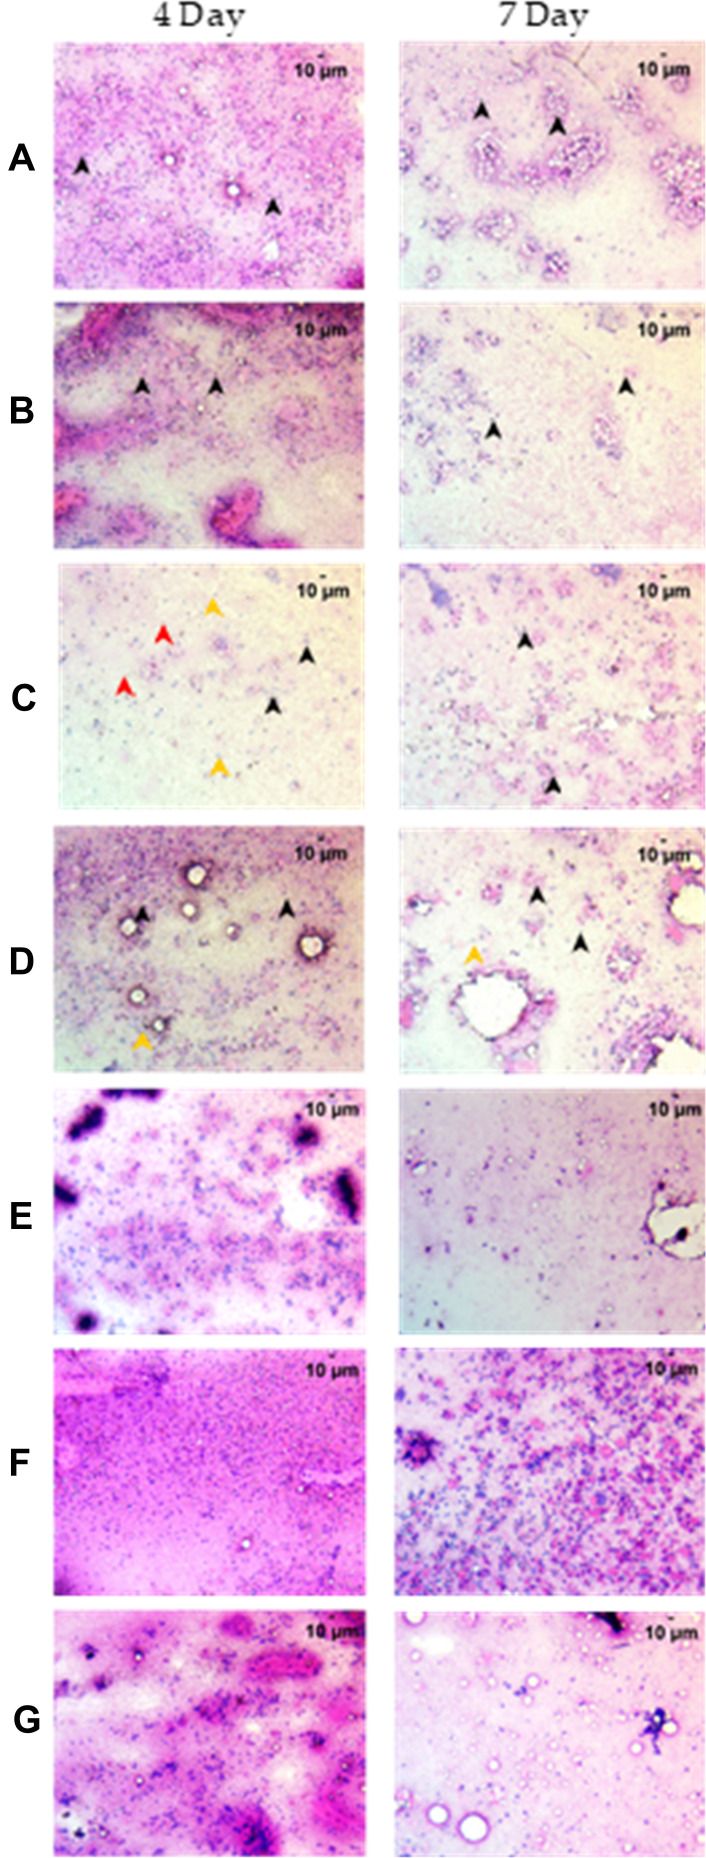
Figure 5.
Cytological examination of the kidney after staining with Hematoxylin and Eosin at 200X magnification. (A) Normal Control (B). Humanized zebrafish with xenotransplanted A549 cells (HZF) (C). Diseased fish with SARS-CoV-2 spike protein (HZF-SARS-CoV-2-S) (D). Dexamethasone (0.08 µg/kg) treatment (E). Divya-Swasari-Vati treatment (6 µg/kg) (F). Divya-Swasari-Vati treatment (28 µg/kg) (G). Divya-Swasari-Vati treatment (142 µg/kg). Black arrowheads depict the nuclei of normal cells, yellow represent degenerative cells, while the red arrowheads depict necrotic cells.

