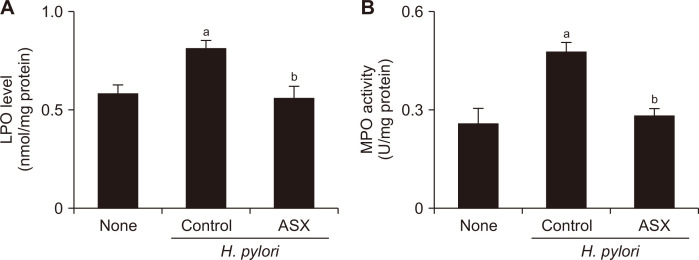
Figure 2. Effect of astaxanthin on lipid peroxide (LPO) level and myeloperoxidase (MPO) activity in the gastric mucosal tissues of H. pylori-infected mice.
(A) Graph showing the level of LPO in each of the three groups, expressed as nmol/mg of protein. (B) Graph showing MPO activity in each of the three groups, expressed as units/mg protein. Values are presented as mean ± SEM (n = 5 for each group). None, non-infected mice fed standard chow; Control (H. pylori control), H. pylori-infected mice fed standard chow; ASX (H. pylori + ASX), H. pylori-infected mice fed chow supplemented with astaxanthin (ASX). aP < 0.05 vs. None, bP < 0.05 vs. infected controls (H. pylori control).

