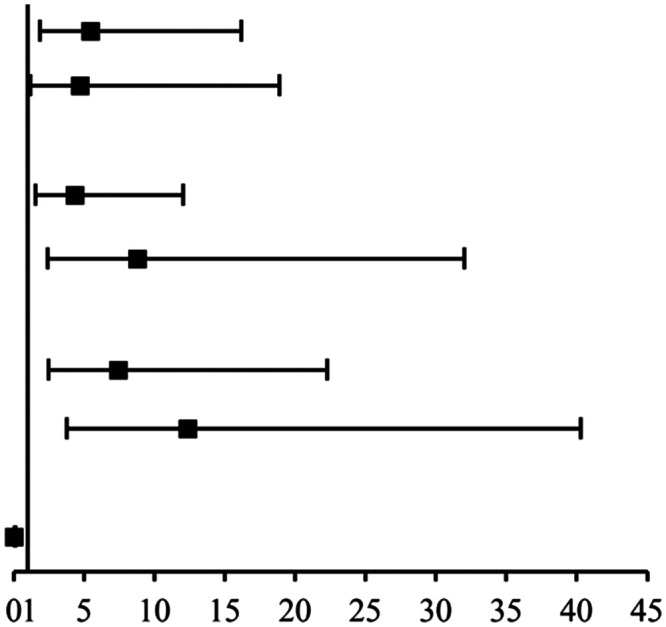
Table 5.
Attributable risk factors associated with recurrent urinary tract infection in multivariable analysis.
| Variables | OR (95% CI) | Adjusted ORa (95% CI) | P value | |
|---|---|---|---|---|
| Wiping from back to front | 3.86 (1.68–8.83) | 5.46 (1.84–16.20) |

|
<0.001 |
| Sedentary >6 hours/day | 4.59 (1.03–20.34) | 4.68 (1.16–18.89) | <0.05 | |
| Delayed voiding | ||||
| Sometimes | 4.85 (2.01–11.69) | 4.35 (1.57–12.04) | <0.001 | |
| Always/often | 7.22 (2.29–22.75) | 8.78 (2.41–32.00) | <0.001 | |
| Chronic constipation | ||||
| Sometimes | 4.91 (2.14–11.26) | 7.43 (2.48–22.26) | <0.001 | |
| Frequent | 6.88 (2.78–17.04) | 12.36 (3.80–40.26) | <0.001 | |
| Drinking green tea | ||||
| >3 cups/month | 0.06 (0.01–0.28) | 0.02 (0.01–0.15) | <0.001 |
OR: adjusted for body mass index, time since the last menstrual period, marital status, education level, number of deliveries, smoking, and liquid consumption. OR, odds ratio; CI, confidence interval. In the chart, symbols represent ORs and bars represent the 95% CIs.
