
Figure 4.
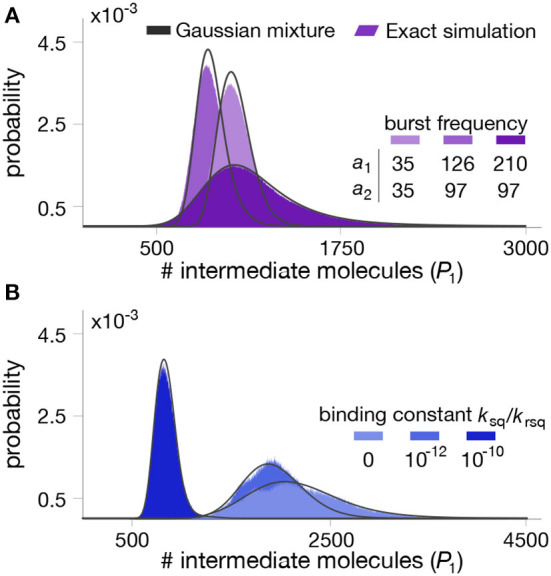
Stationary distributions for the intermediate metabolite in a two-step pathway with end-product inhibition. The panels show the distribution of intermediate metabolite P1 for different combinations of parameter values. (A) Impact of enzyme bursting frequency a1 and a2. (B) Impact of binding constant between the first enzyme and the end-product. All parameter values can be found in Table 2.