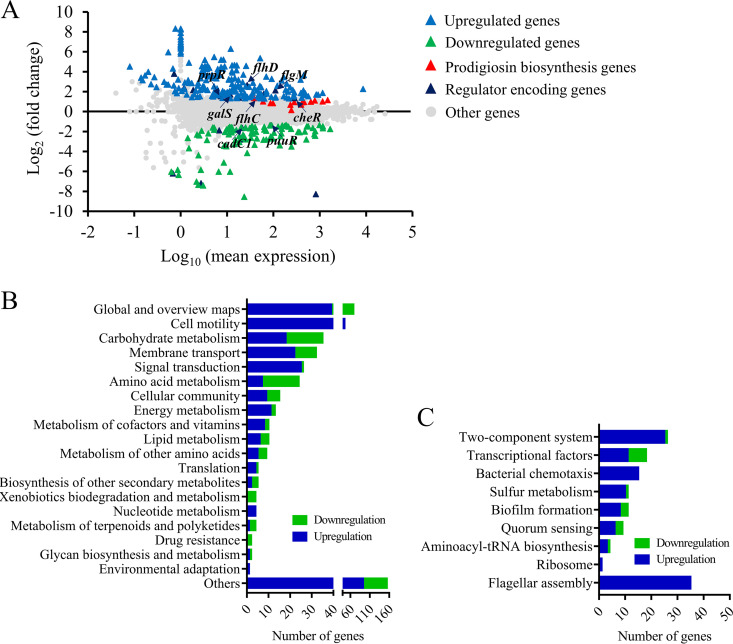
FIG 3.
Transcriptome analysis of strains JNB5-1 and rcsB-disrupted mutant SK68. (A) Genome-wide analysis of gene expression differences between the rcsB-disrupted mutant SK68 and the wild-type strain JNB5-1 at an OD600 of 2.0. The x axis represents the logarithmic transformation value of gene expression levels in strain JNB5-1. The y axis represents log2-transformed values of gene expression fold changes between strains SK68 and JNB5-1. Light blue and green triangles represent the upregulated and downregulated genes, respectively. Dark blue represents the regulator-encoding genes. (B) Genes significantly differentially expressed by strains SK68 and JNB5-1 were classified into different cellular processes according to KEGG_B_class. (C) Expression profiles of the genes belonging to the indicated metabolic pathways. (B and C) Genes with significantly elevated and reduced expression levels in strain SK68 compared to strain JNB5-1 are shown in blue and green, respectively.

