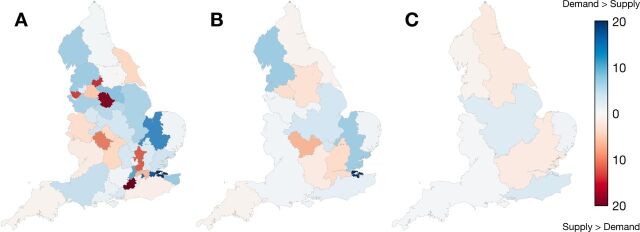
Figure 3.
The absolute percentage difference between the number of patients undergoing surgery resident within a surgical community (demand) and the number of procedures performed by hospitals within the community (supply) for configurations of 45 (panel A), 16 (panel B) and 7 (panel C) surgical communities. Areas in blue represent those surgical communities where procedures performed on patients outnumber those performed by the local providers.

