Figure 3.
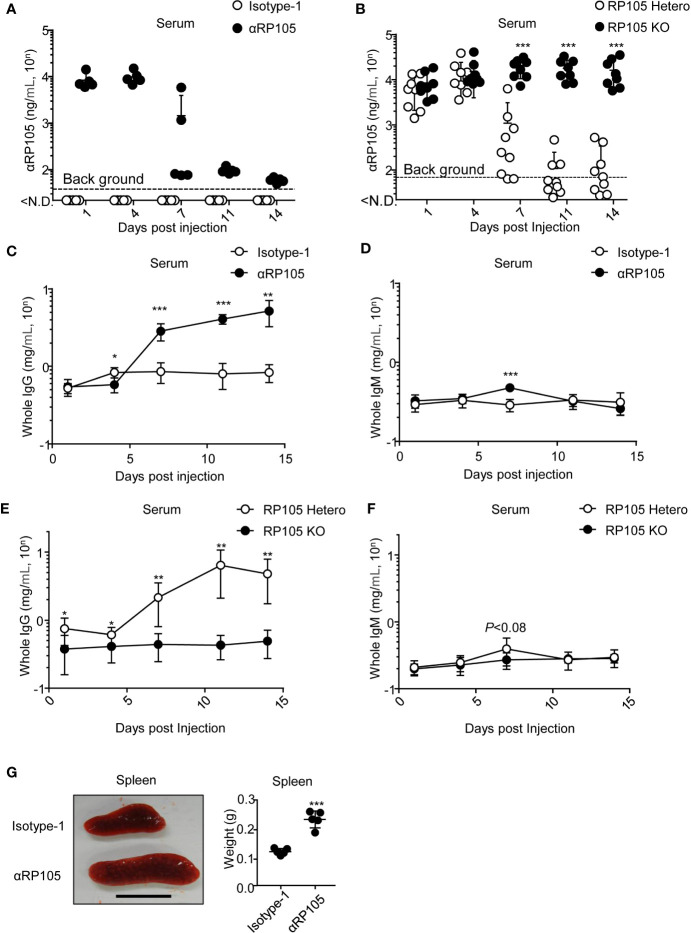
αRP105 enhances the level of whole IgG in the serum, which depends on RP105, and enlarges the spleen. (A) BALB/c mice (n = 5) were subjected to HD with pCADEST1-anti-HA mIgG1 and pCADEST1-anti-HA mkappa (Isotyope-1) or pCADEST1-anti-RP105 mIgG1 and pCADEST1-anti-RP105 mkappa (αRP105). After the indicated times, the serum was obtained. The expression level of αRP105 was quantified using Ba/F3 cells expressing RP105/MD-1 (B2) using a BD LSRFortessa. The background level [38.1 (=101.581) ng/ml] was also determined using Ba/F3-null cells. (B) BALB/c RP105-Hetero or RP105-KO mice were subjected to HD with pCADEST1-anti-RP105 mIgG1 and pCADEST1-anti-RP105 mkappa. After the indicated times, the serum was obtained. The expression level of αRP105 was quantified by flow cytometry using Ba/F3 cells expressing RP105/MD-1 (B2). The background level [68.4 (=101.835) ng/ml] was also determined using Ba/F3-null cells. (C, D) Whole IgG (C) and IgM (D) levels in the serum (A) were analyzed by quantitative ELISA. (E, F) Whole IgG (E) and IgM (F) levels in the serum (B) were analyzed by quantitative ELISA. (G) Four days post-HD with the plasmids encoding Isotyope-1 or αRP105 into BALB/c WT mice (n = 5), the spleens were collected, and their weights were measured. The scale bar represents 1 cm. The indicated data (A, C, D, G) are representative of at least two independent experiments and are indicated as the mean ± S.D. The indicated data (B, E, F) are combined from two independent experiments (n = 8–9) and are indicated as the mean ± S.D. The detection limit was over 0.0147 (=10-1.832) mg/ml (C, E) or 0.0234 (=10-1.63) mg/ml (D, F). *P < 0.05, **P < 0.01, ***P < 0.001 (Student’s t-test).

