Figure 5.

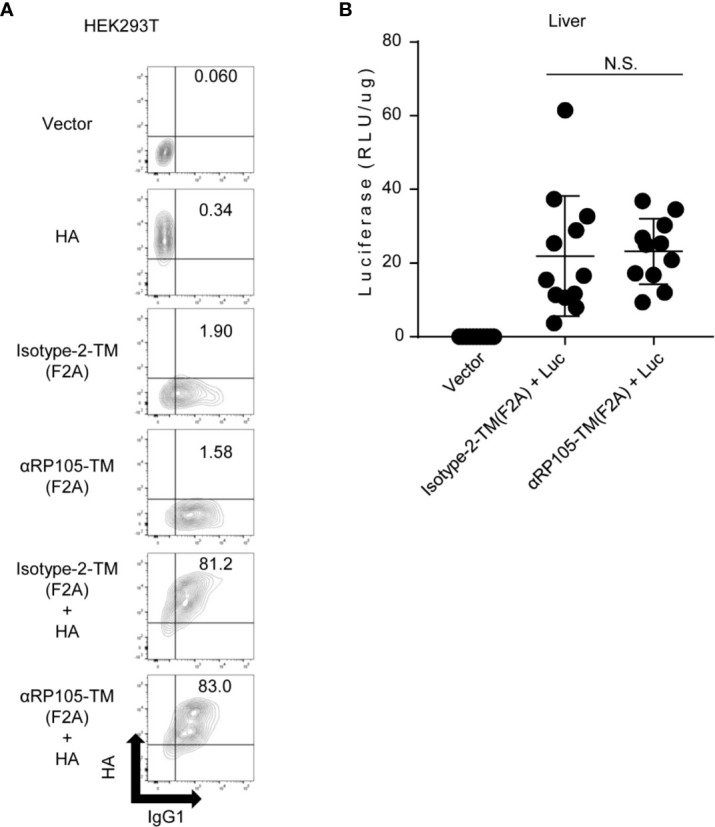
Antigen expression level in vivo and in vitro is not significantly different with co-expression of Isotype-2-TM and αRP105-TM. (A) HEK293T cells were co-transfected as indicated. Isotype-2-TM (F2A) was expressed from pCADEST1-anti-OVA kappa-F2A-anti-OVA mIgG1-TM ( Figure S4 ). Two days later, these cells were collected and incubated with FITC-conjugated anti-mouse IgG1 and anti-HA IgD, followed by incubation with APC-conjugated anti-mouse IgD. The indicated numbers represent the ratio (%) of IgG1+HA+ cells in total. The expression level was analyzed using a BD LSRFortessa. The indicated data are representative of at least two independent experiments. (B) Female BALB/c mice were subjected to HD with either pCADEST1-empty (Vector), pCADEST1-anti-OVA kappa-F2A-anti-OVA mIgG1-TM [Isotype-2-TM (F2A)] and pCADEST1-luciferase (Luc), or pCADEST1-anti-RP105 kappa-F2A-anti-RP105 mIgG1-TM [αRP105-TM (F2A)] and pCADEST1-Luc, as indicated. One day later, the liver was obtained, and luciferase activity was determined. The indicated data are combined from three independent experiments (n = 11–12) and indicated as the mean ± S.D. N.S., not significant (Mann-Whitney test).
