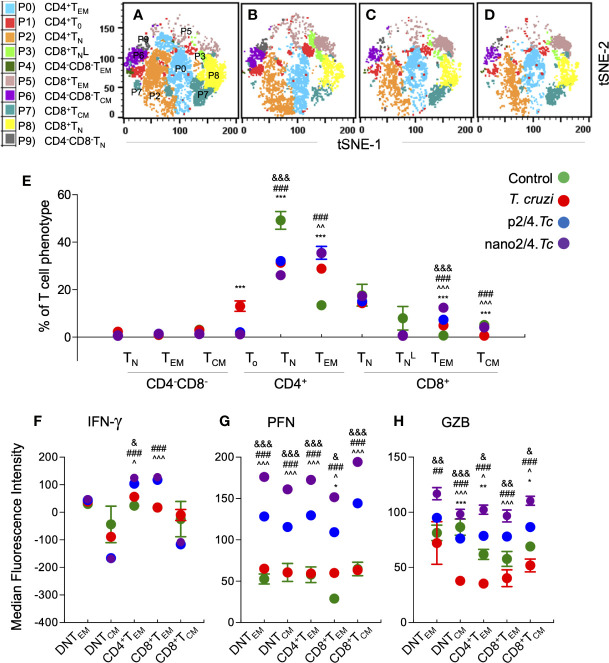
Figure 5.
Effect of nanovaccine on dynamics of functional activation of T cell sub-populations after re-exposure to T. cruzi. C57BL/6 mice were immunized with two doses of p2/4 or nano2/4 at 21 days interval, infected on day 21 after 2nd vaccine dose, re-challenged on day 21 after first infection, and euthanized on day 7 after re-challenge. Single cell suspensions of splenocytes were labeled with fluorescent-conjugated antibodies and analyzed by flow cytometry. FlowSOM analysis of CD3+ splenic T cells of mice (1 × 10⁵ live cells per mouse, n ≥ 5 per group) based on the expression levels of CD4, CD8, CD25, CD62L, and CD44 antigens generated self-organizing ten meta-clusters (referred as P0–P9). (A–D) The tSNE (t-distributed stochastic neighbor embedding) plots were generated with non-linear reduction method to visualize all the 10 sub-populations in two-dimensional space in non-vaccinated/non-infected (A), non-vaccinated/infected (B), p2/4.Tc (C), and nano2/4.Tc (D) groups of mice. (E) Bar graphs show P0–P9 sub-populations of T cells in four groups of mice. (F–H) Median fluorescent intensity was calculated for intracellular cytokine (IFN-γ) and markers of T cell cytotoxicity [perforin (PFN) and granzyme B (GZB)] in T central memory (TCM) and T effector/effector memory (TEM) subsets. All data are derived from n ≥ 5 mice per group (≥ 2 observations per sample) and plotted as mean values ± SEM. Significance is presented as described in Figure 1 . Detailed data (mean values ± SEM and significance) are shown in Tables S2C and S3C .

