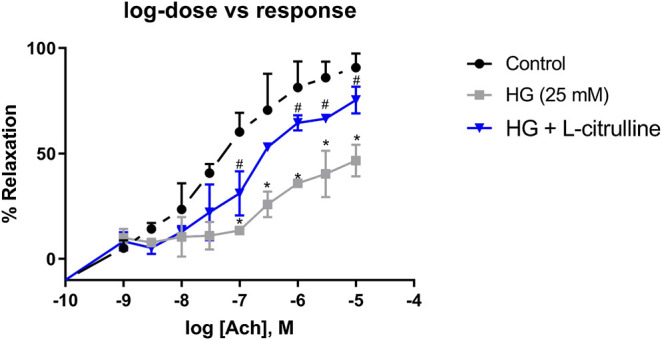
FIGURE 6.

Vascular Endothelial Dysfunction caused by high glucose treatment is mitigated with L-citrulline. Aortic endothelium dependent relaxation to acetylcholine (ACh). Solid black line indicates responses in control rings. Gray tone line indicates responses in high glucose treated rings. Blue lines indicate response in high glucose + L-citrulline treated rings. Mean aortic vasorelaxation responses of n = 4 calculated as a percentage of respective control responses. Statistical analysis performed using one-way ANOVA followed by Tukey’s post hoc test. HG; high glucose, Cont; control. *HG vs control p < 0.05. # vs HG + L-citrulline p < 0.05.
