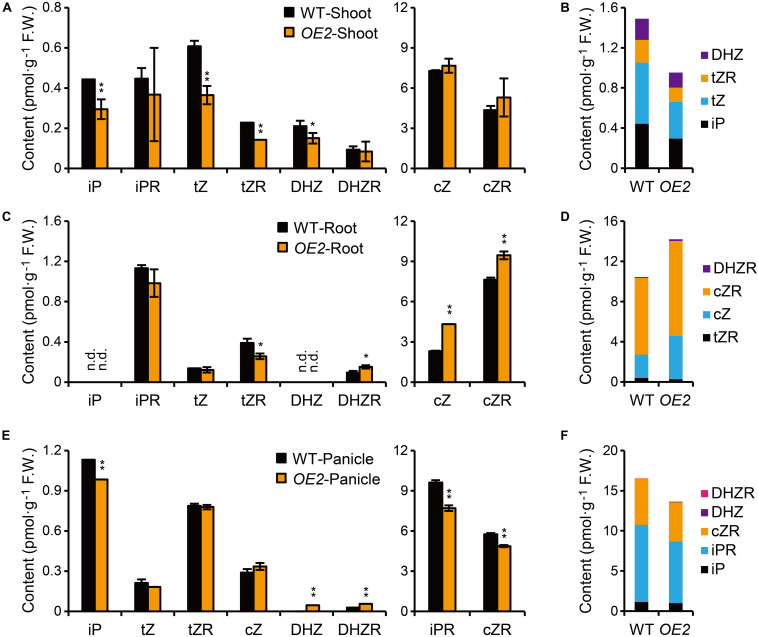
FIGURE 3.
Quantification of CKs in OsPUP1-overexpressing plants. (A,C,E) Quantification of CKs in shoots (A) and roots (C) of 10-day-old seedlings and panicles (E) with 18–20 cm length of the wild-type (WT) and OsPUP1-overexpressing plants (OE2). See Supplementary Table 1 for individual values. Different CK forms were grouped according to the content. n = 3, bar = SD. n.d., not detected. *P < 0.05 and **P < 0.01 in Student’s t-test. Asterisks indicate statistically significant difference of OE2, compared with WT. (B,D,F) Total amounts of the biologically active forms of CKs with statistical significance in shoots (B), roots (D), and panicles (F). FW, fresh weight.

