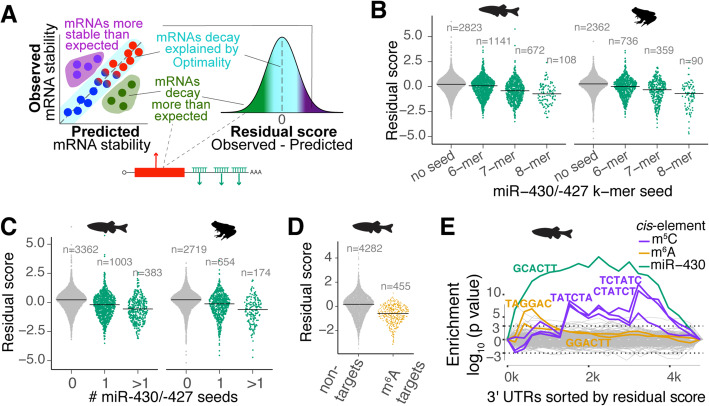
Fig. 3.
Dissecting cis-regulatory elements after accounting for codon-mediated regulation. a Diagram describing the residual score (observed − predicted). mRNAs that decay more than expected by the model show negative residuals and potentially contain destabilizing cis-regulatory elements. The mRNAs with positive residual scores might have stabilizing cis-regulatory elements. b, c The model overestimates the mRNA stability of miR-430 targets. Sinaplot showing the distribution of the residual scores for targets and not targets of miR-430. In this type of plot, each dot represents an individual mRNA. The targets of miR-430 are grouped by the type of miR-430 seed (b) (p < 2 × 10⁻¹⁶, ANOVA test) or by the number of target seeds (c) (p < 2 × 10⁻¹⁶, ANOVA test) present in the 3′UTR during the MZT in zebrafish (Additional file 1: Fig. S1a-b) and Xenopus [33]. d The model also overestimates the stability of mRNAs that contain m6A methylation mark. Sinaplot showing that m6A targets [10] display lower residual score distribution than not targets during the MZT in zebrafish (p < 2 × 10⁻¹⁶, t test). e Sylamer landscape plot that tracks occurrence biases of 6-nucleotide words in the 3′UTRs using hypergeometric p values for all words across the mRNAs ranking based on residual values [35]. The highlighted 6-mers are significantly associated with mRNA stabilization (TATCTA, CTATCT, and TCTATC) and destabilization (GCACTT, TAGGAC, and GGACTT). The color shows the putative regulatory pathway that recognizes these 6-mers. The dotted line shows a hypergeometric p = 0.01

