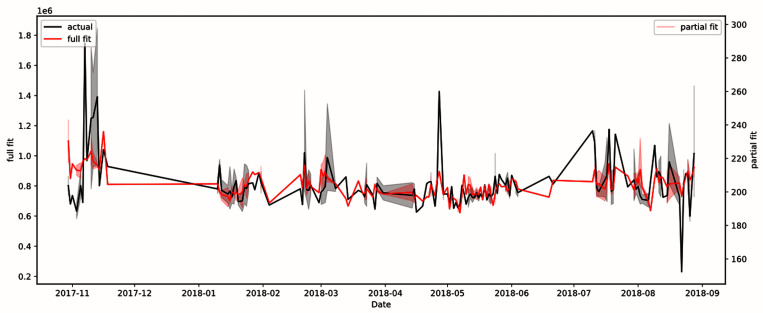
Figure 3. Model of gray brain matter using patient age, patient position in scanner, patient sex, patient weight, total signal-to-noise ratio, and seasonal variation.
R 2 value was 0.242. The full fit plot (in red) shows the plot of all independent variables, whereas the partial fit plot (in pink) shows the plot of only the statistically significant variables. The black plot shows the actual fit of the real data.

