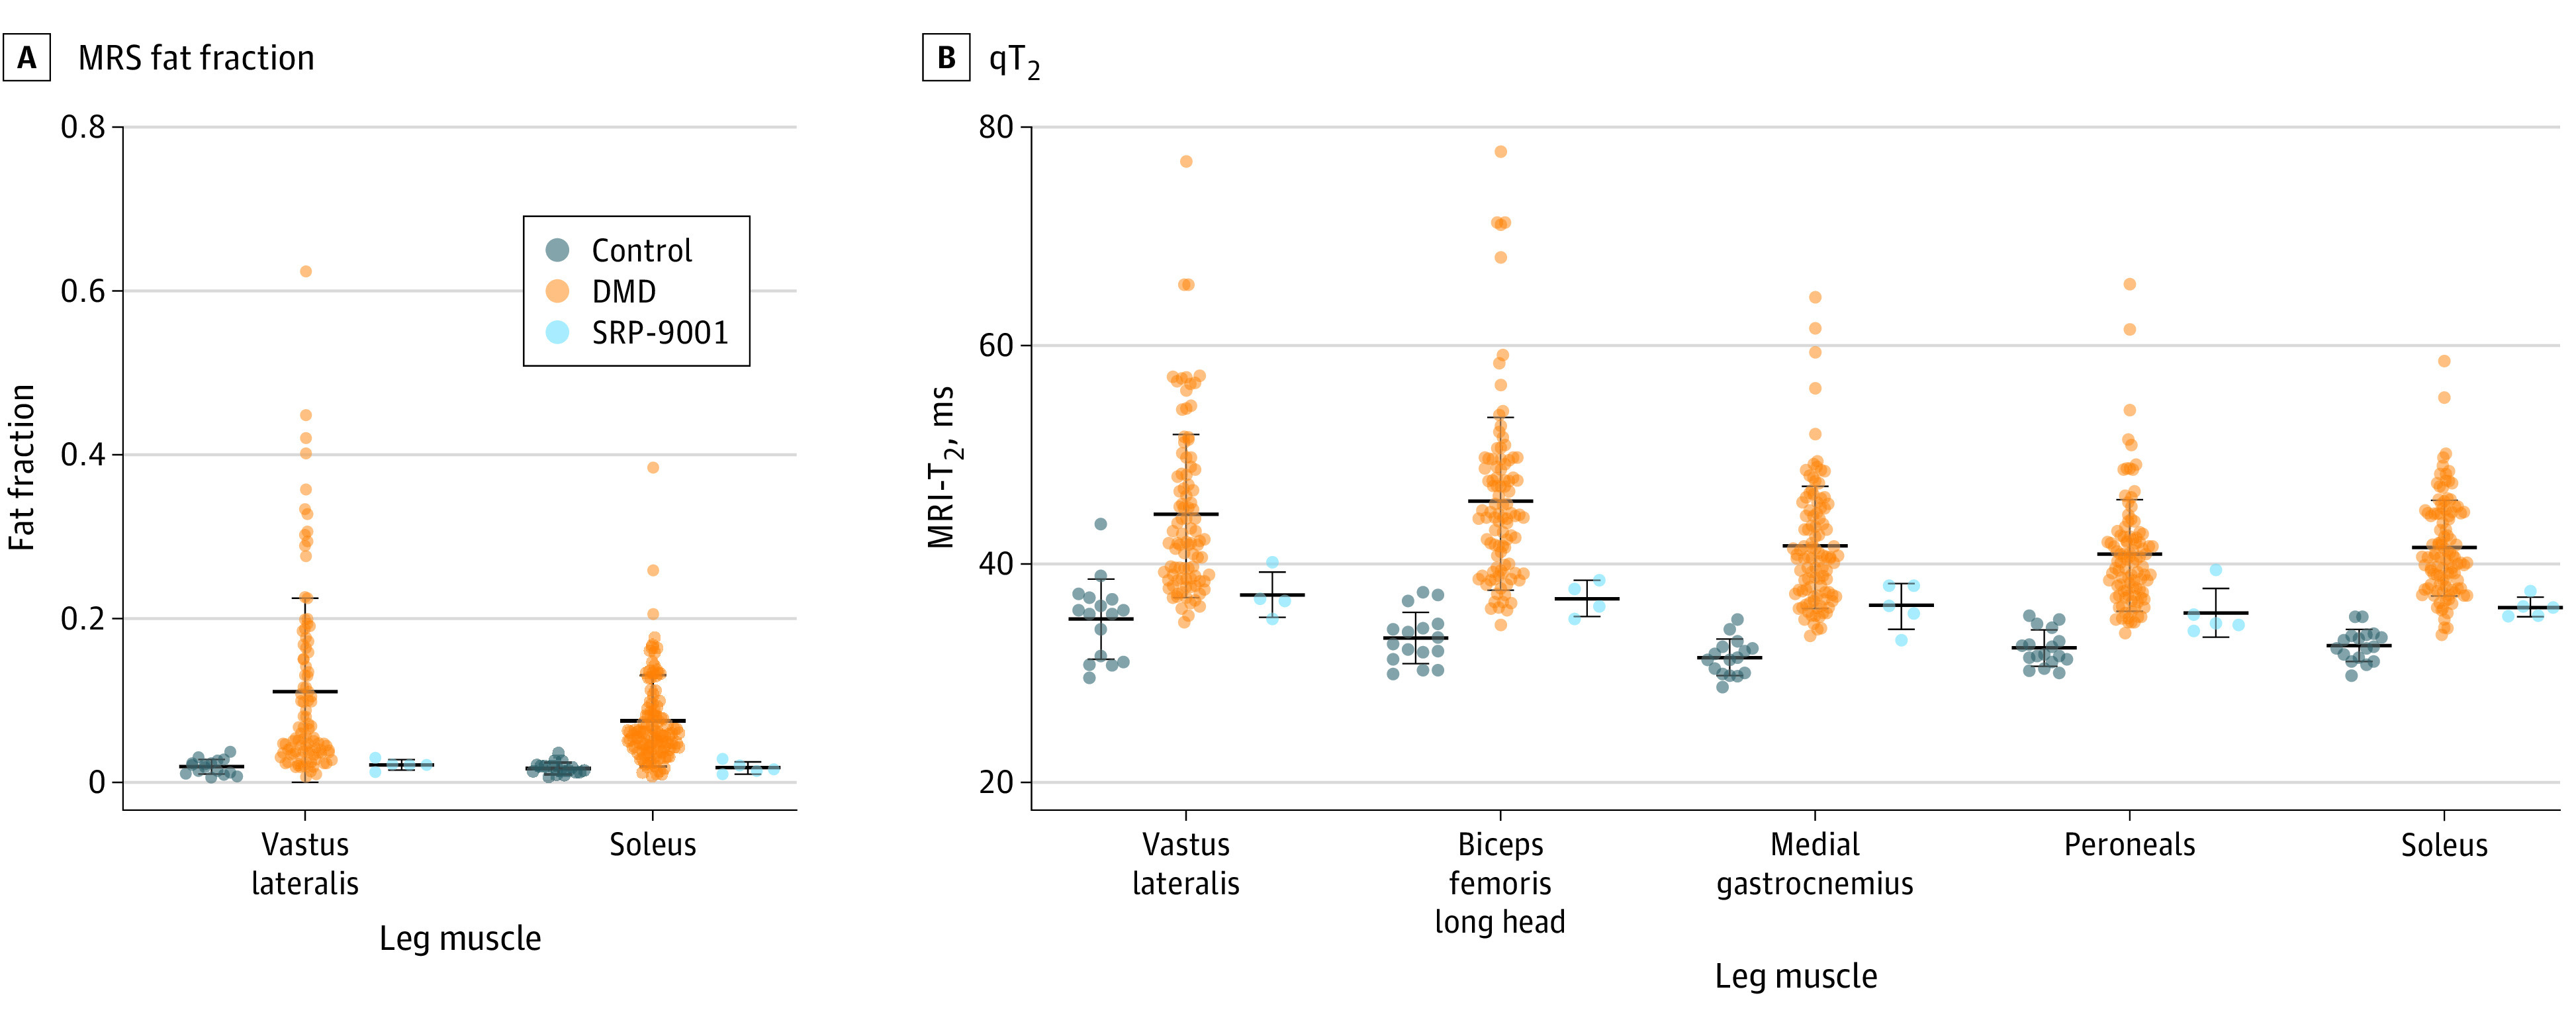
Figure 2. Fat Fraction and Transverse Relaxation Time (qT2) Across Multiple Muscles Based on Quantitative Magnetic Resonance Imaging (MRI) and Spectrometry (MRS).

The fat fraction (A) and qT2 (B) were lower in participants in the SRP-9001 cohort across multiple leg muscles compared with those in the natural history cohort. Due to motion artifact, no upper leg qT2 data were available for 1 participant in the SRP-9001 cohort. Although statistical analysis was not performed, group mean data reflected lower quantitative MR biomarker values in the SRP-9001 cohort. Dots indicate individual data points; center lines, means; whiskers, SDs.
