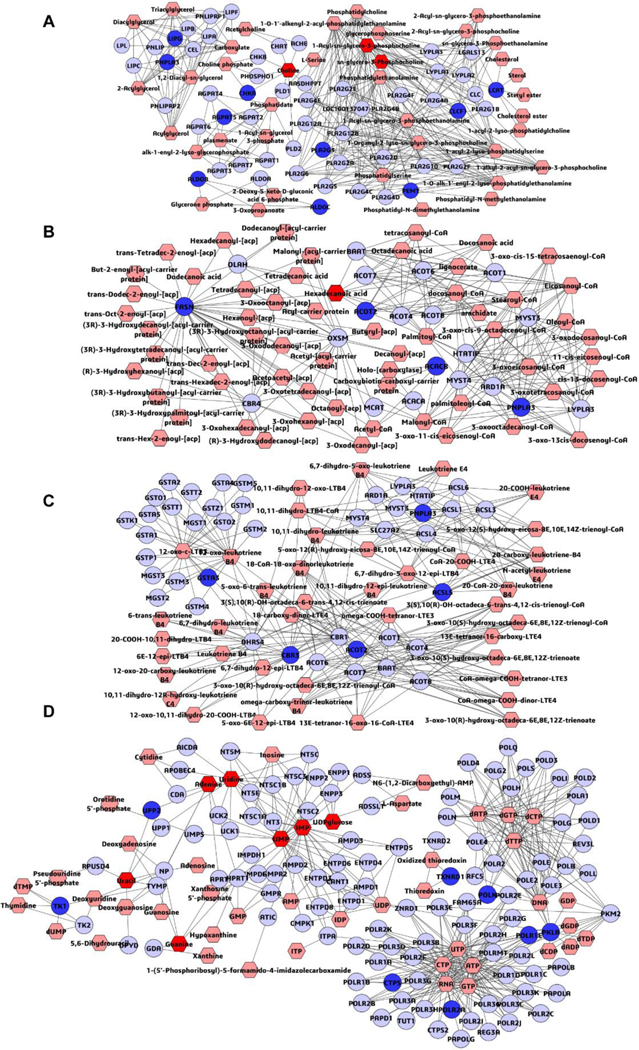
Figure 10.

Metabolomic correlation networks of the differential metabolites (hexagons) and genes (rounds) represented in different dosage groups. Input metabolites were shown in red and input genes were shown in blue. The metabolic networks of glycerophospholipid metabolism (A), fatty acid biosynthesis (B), leukotriene metabolism (C), purine metabolism and pyrimidine metabolism (D).
