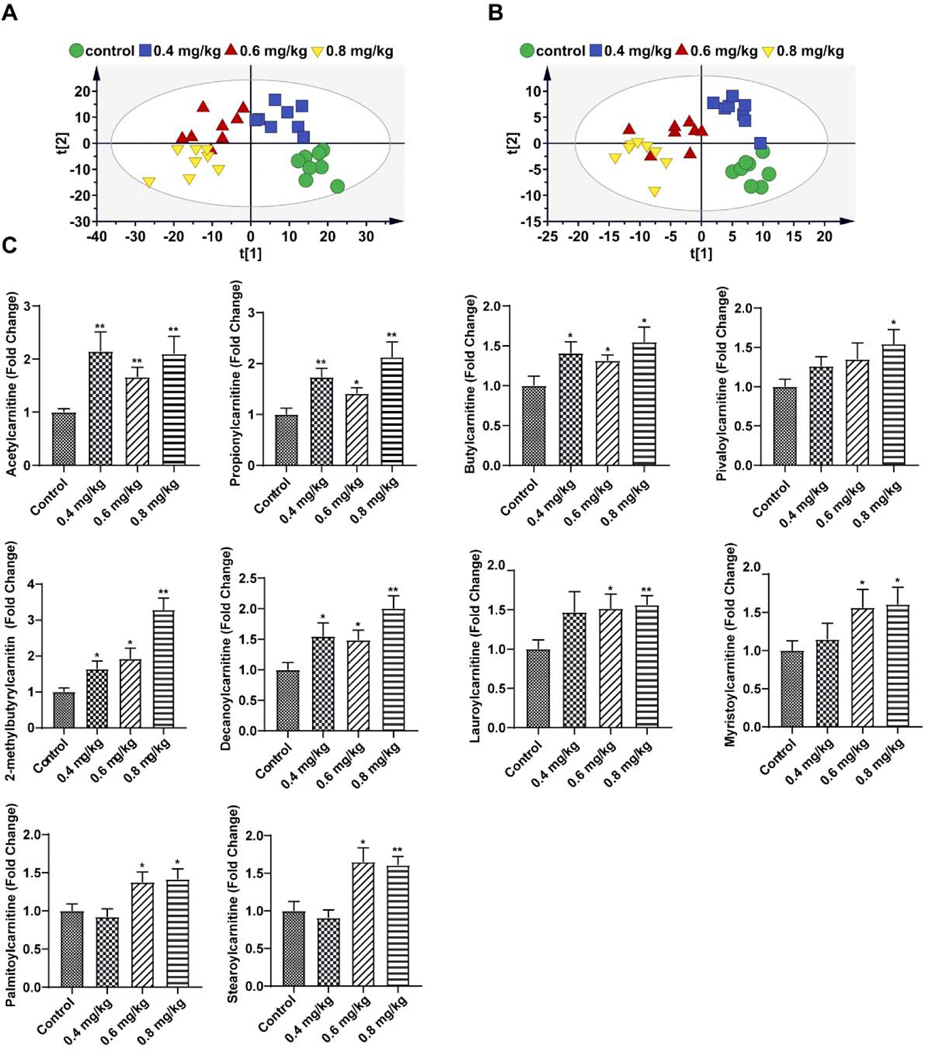
Figure 8.
Metabolomic analysis of liver tissue in control and mice treated with 0.4 mg/kg, 0.6mg/kg and 0.8 mg/kg of triptolide. (A) Scores scatter plot of liver metabolites in control mice and mice treated with three dosages of triptolide as determined by PLS-DA in positive mode. (B) Scores scatter plot of liver metabolites in control mice and mice treated with three dosages of triptolide as determined by PLS-DA in negative mode. (C) Quantitation of acetylcarnitines in the liver. The data were expressed as mean ± SEM (n=8). Statistical analyses were performed with Student’s t tests. *p <0.05, **p<0.01.

