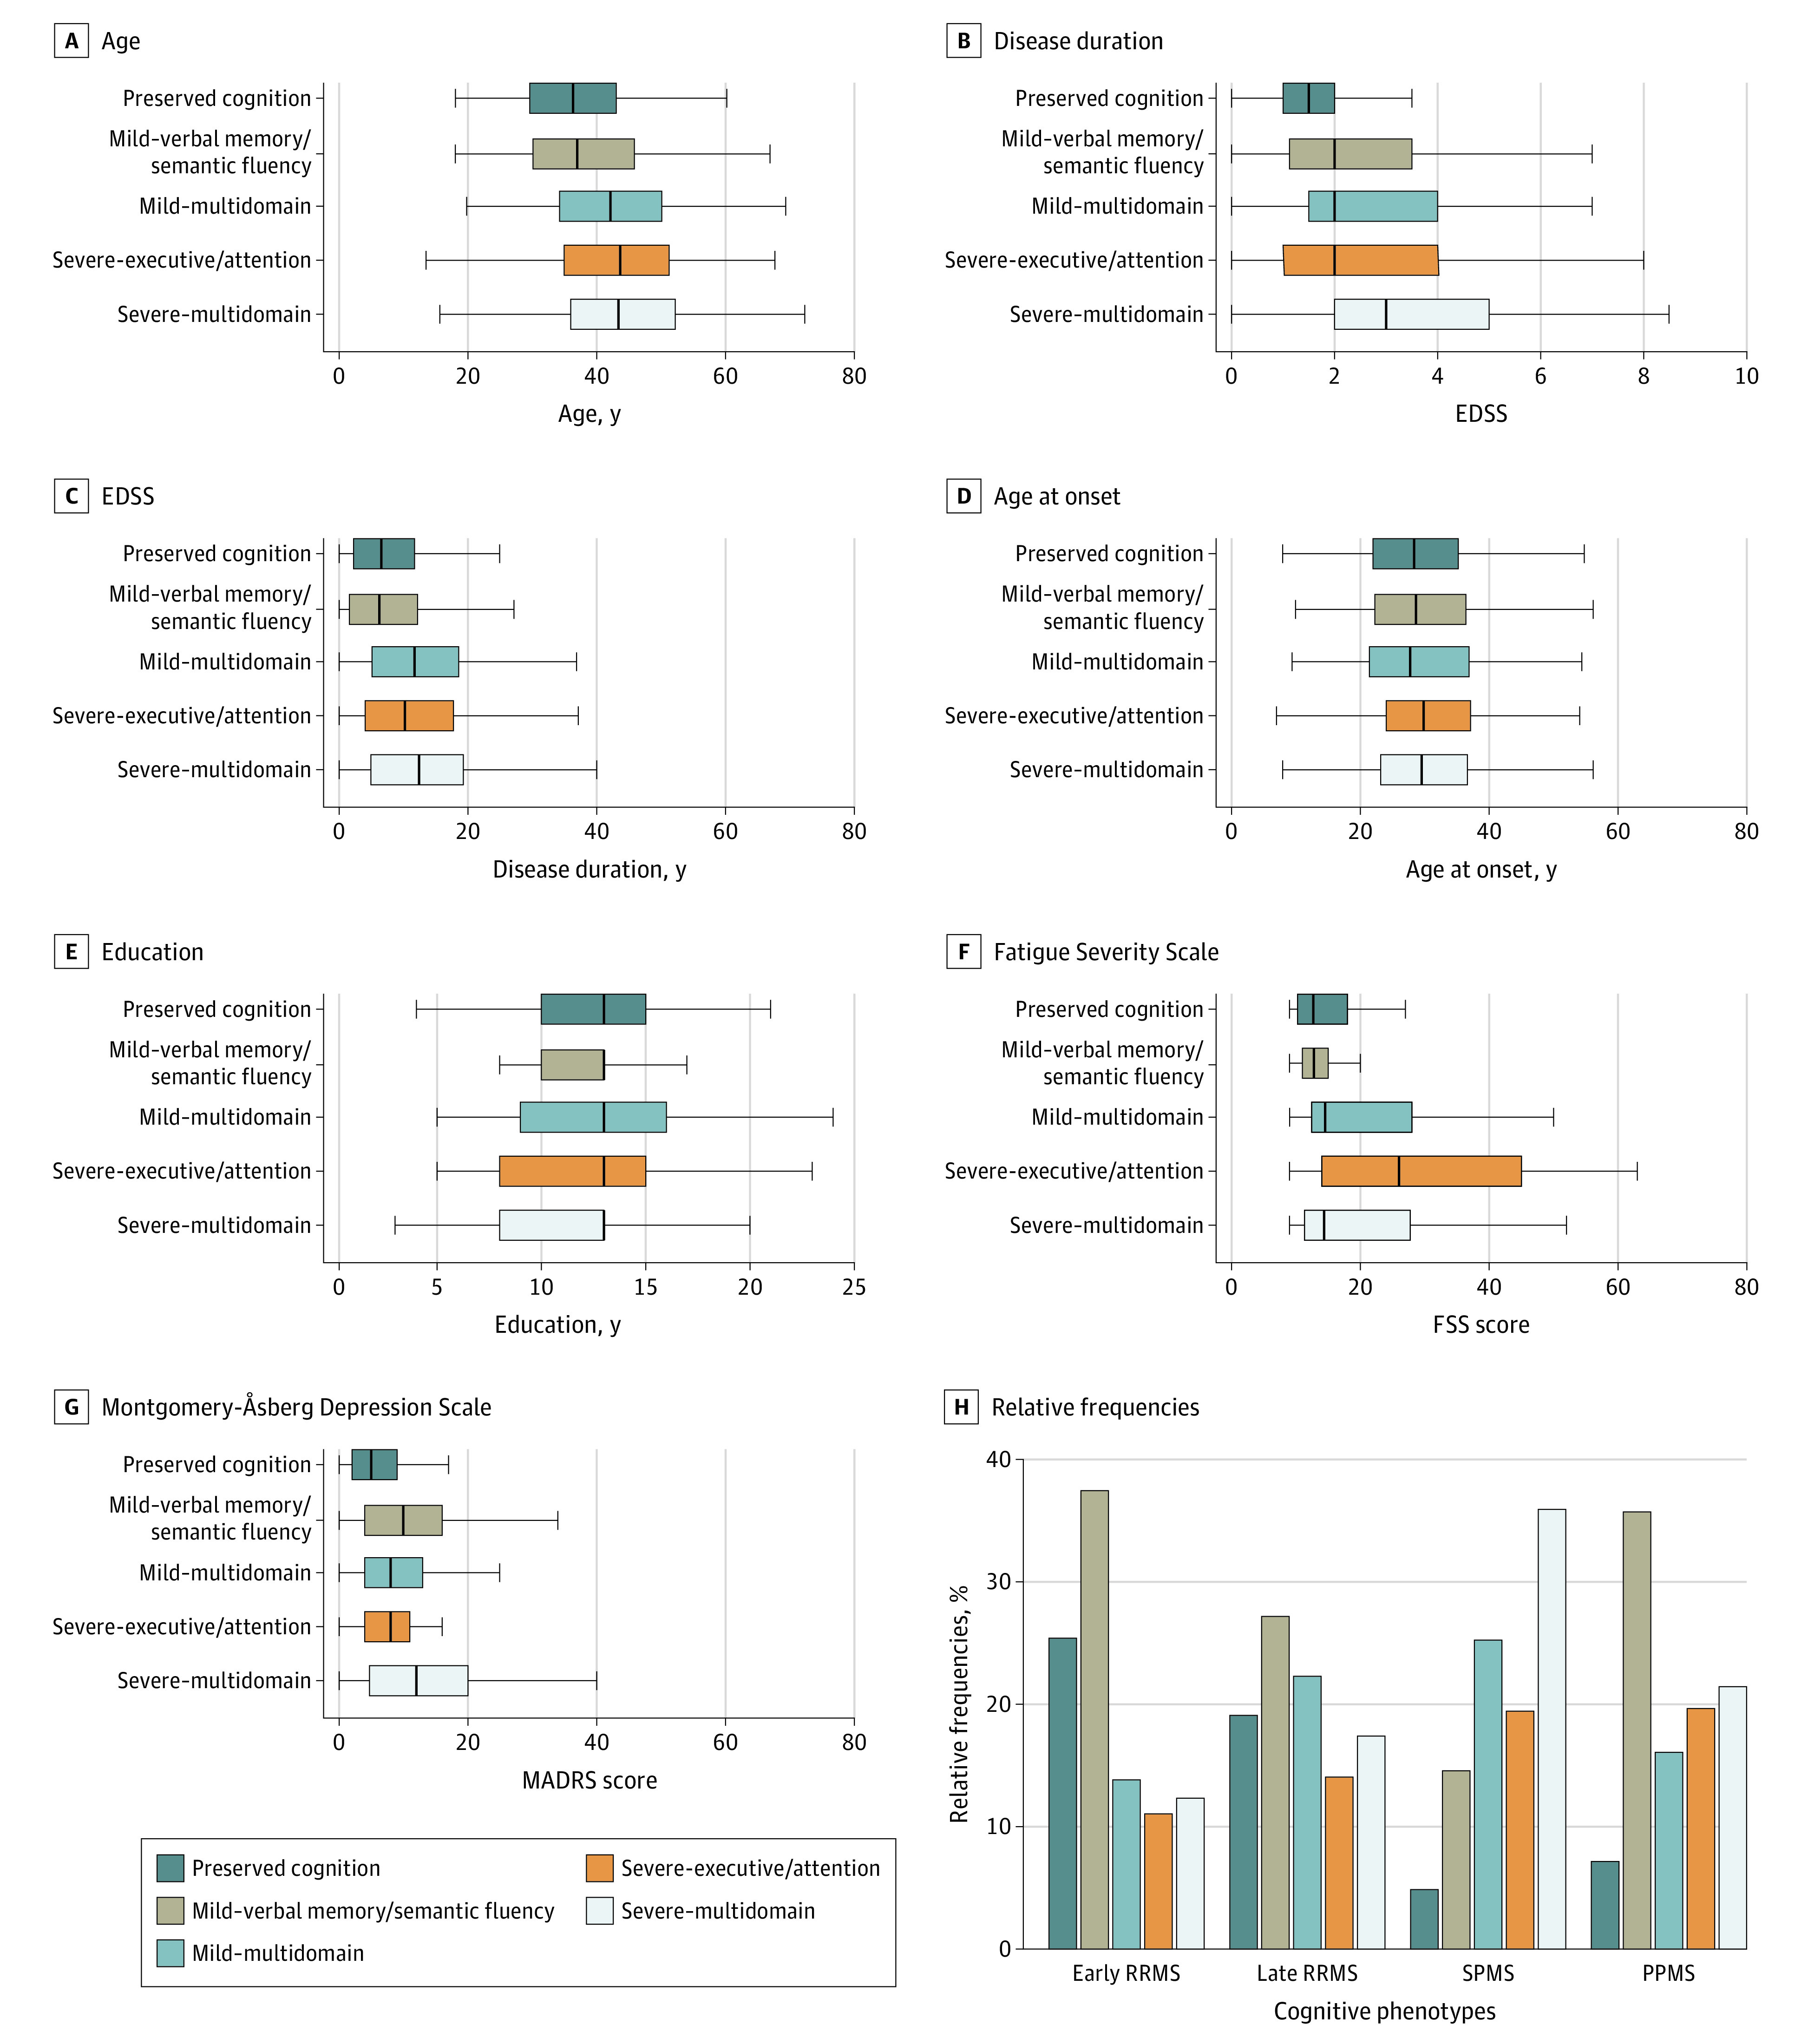
Figure 1. Clinical and Demographic Features of Clinical Phenotypes.

A-G, Boxplots are represented for each phenotype. H, The histograms show the relative frequencies as percentages of cognitive phenotype within clinical phenotypes from left to right: early relapsing-remitting multiple sclerosis (RRMS), late RRMS, secondary progressive multiple sclerosis (SPMS), and primary progressive multiple sclerosis (PPMS). EDSS indicates Expanded Disability Status Scale.
