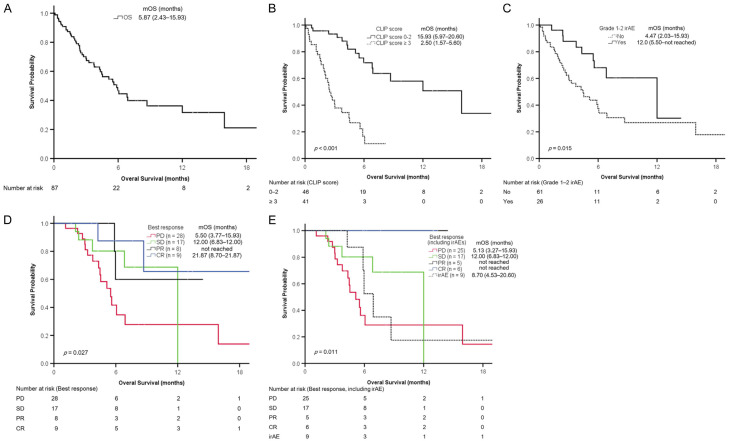
Figure 2.
Kaplan-Meier analyses of overall survival. A. All patients. B. Patients with higher (≥3) or lower (0-2) CLIP score. C. Patients with or without grade 1-2 irAEs. D. Patients with CR, PR, SD, or PD. E. Patients with CR, PR, SD, PD, or ≥ grade 3 irAEs. Continuous variables are presented as the median (first quartile-third quartile). CLIP, Cancer of the Liver Italian Program; CR, complete response; irAE, immune-related adverse event; mOS, median overall survival; PD, progressive disease; PR, partial response; SD, stable disease.

