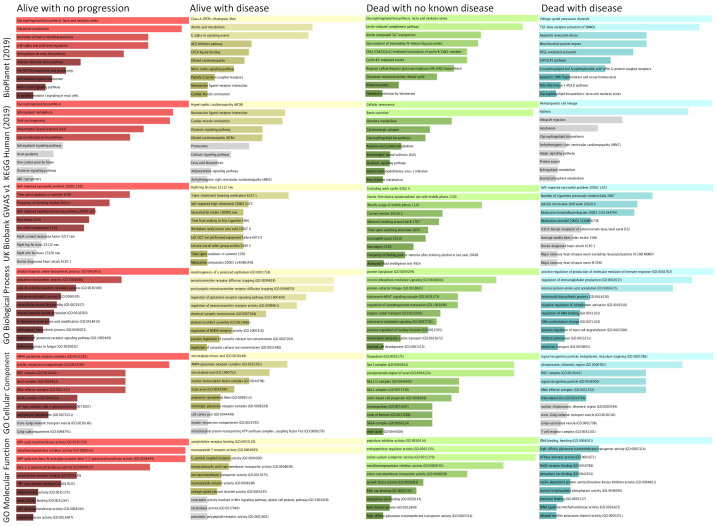
Figure 4.
Gene set enrichment analyses on the top ranked genes based on the coefficient of the multinomial logistic regression model. We conducted the gene-set enrichment analyses for the top-ranked genes based on their associations with respective outcome/groups (coefficient as the metric), using the web-based Enrichr algorithm and p-value based ranking. The length of the bar indicates the degree of the gene-enrichment. The top two rows show the results of pathway analyses using Kyoto Encyclopedia of Genes and Genomes (KEGG) and BioPlanet (2019) algorithms, the third row shows the result of disease-related analysis using algorithm of the UK Biobank genome-wide association study (GWAS) v1, and the bottom 3 rows show the result of analyses using the gene ontologies (GO) algorithms. The far-left column was the alive with no progression group, middle-left column the alive with disease, the middle-right column the dead with no known disease, and the far-right column the dead with disease group, respectively. The lighter shade indicates P<0.01 for gene-enrichment, darker shade indicates P<0.05, and gray shade indicates P≥0.05.

