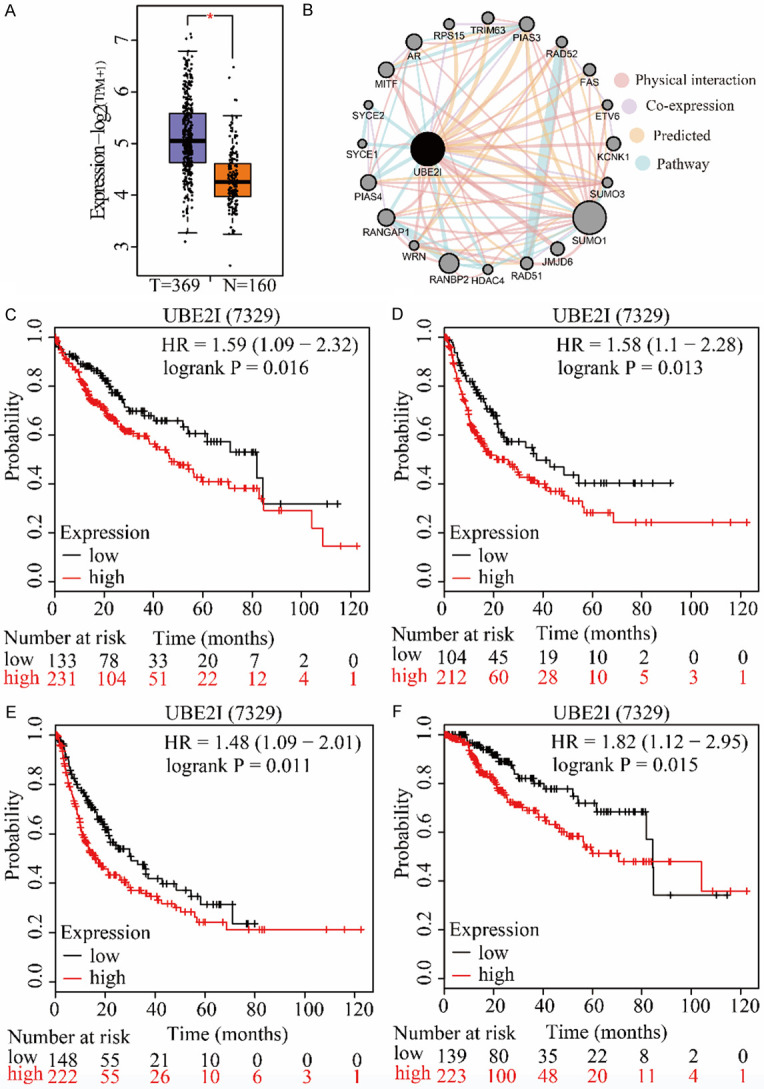
Figure 2.

Clinical analysis and interaction network of UBE2I in HCC. A: Differential expression of UBE2I in HCC. B: Gene-gene interaction network of UBE2I and expression-related genes. C-F: Survival analysis of UBE2I expression affecting OS (low = 133, high = 231), RFS (low = 104, high = 212), PFS (low = 148, high = 222) and DSS (low = 139, high = 223) in HCC.
